Debugging Magic with Vue Devtools

Debugging in Vue is essential for maintaining robust applications, but diagnosing issues in complex Vue.js projects can be challenging. Fortunately, Vue Devtools is here to help!
As your Vue application grows, errors become harder to pinpoint. That's where Vue Devtools comes in—a powerful tool designed to simplify debugging in Vue apps. With its suite of features, Vue Devtools allows you to efficiently identify and fix issues, improving your development workflow.
In this article, we'll show you how Vue Devtools can elevate your debugging skills, helping you quickly track down bugs and troubleshoot with ease. Let’s dive in and unlock its full potential!
Installing Vue DevTools
According to the latest Vue Devtools documentation, there are 3 techniques for setting up Vue Devtools in your workspace.
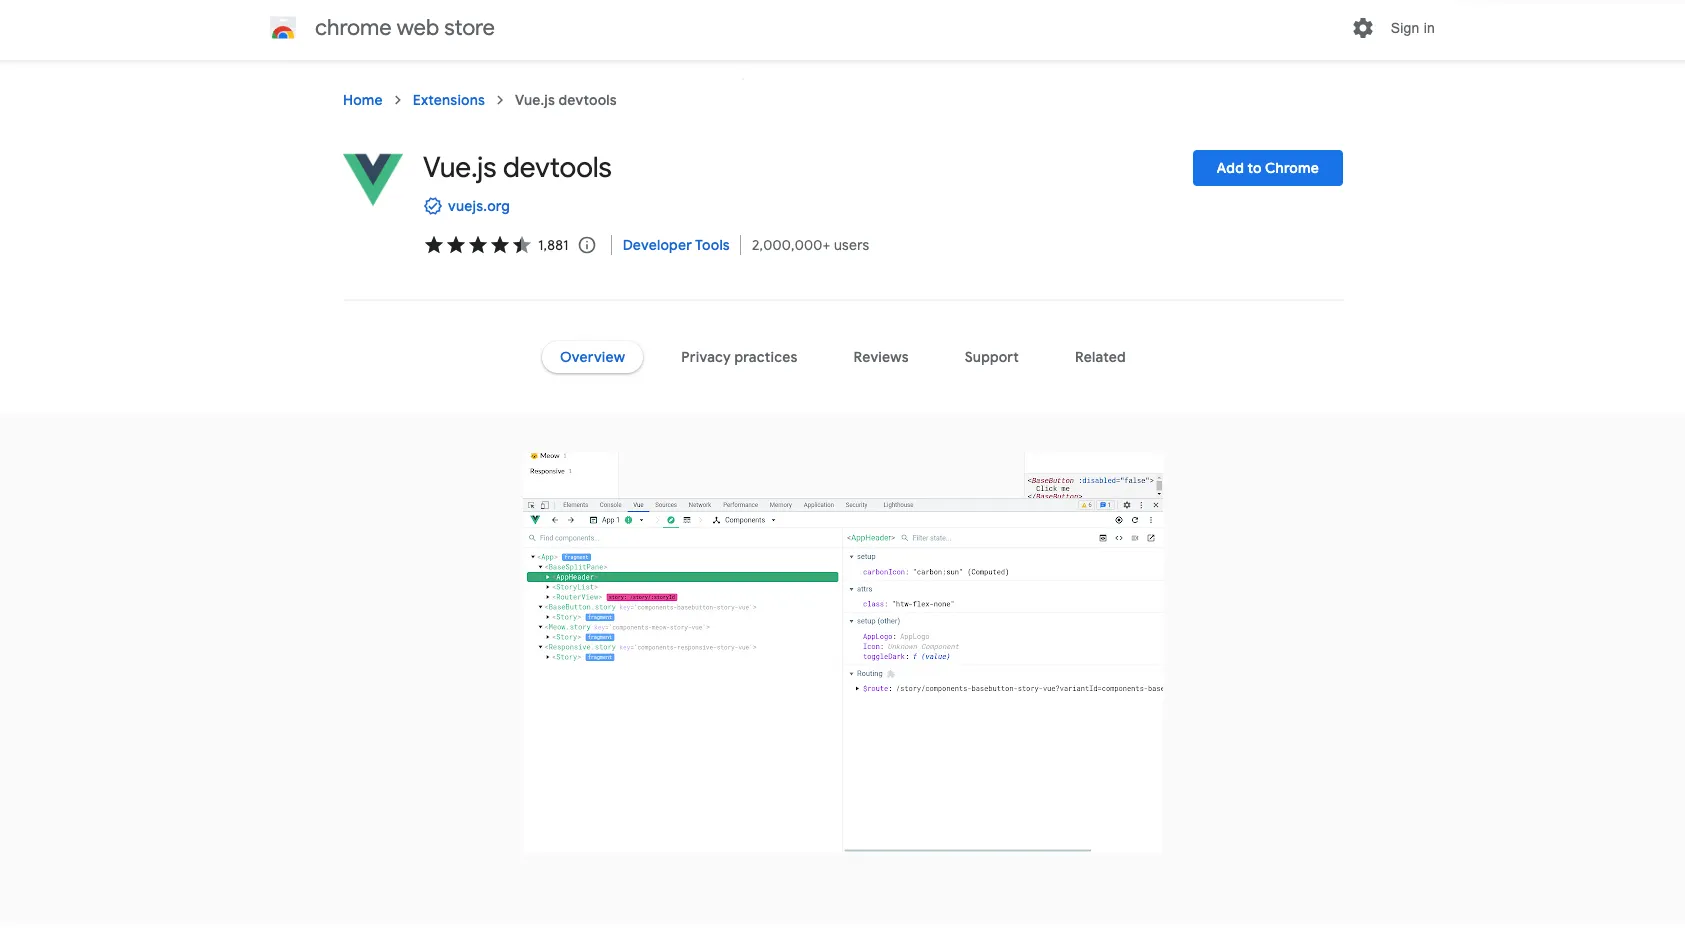
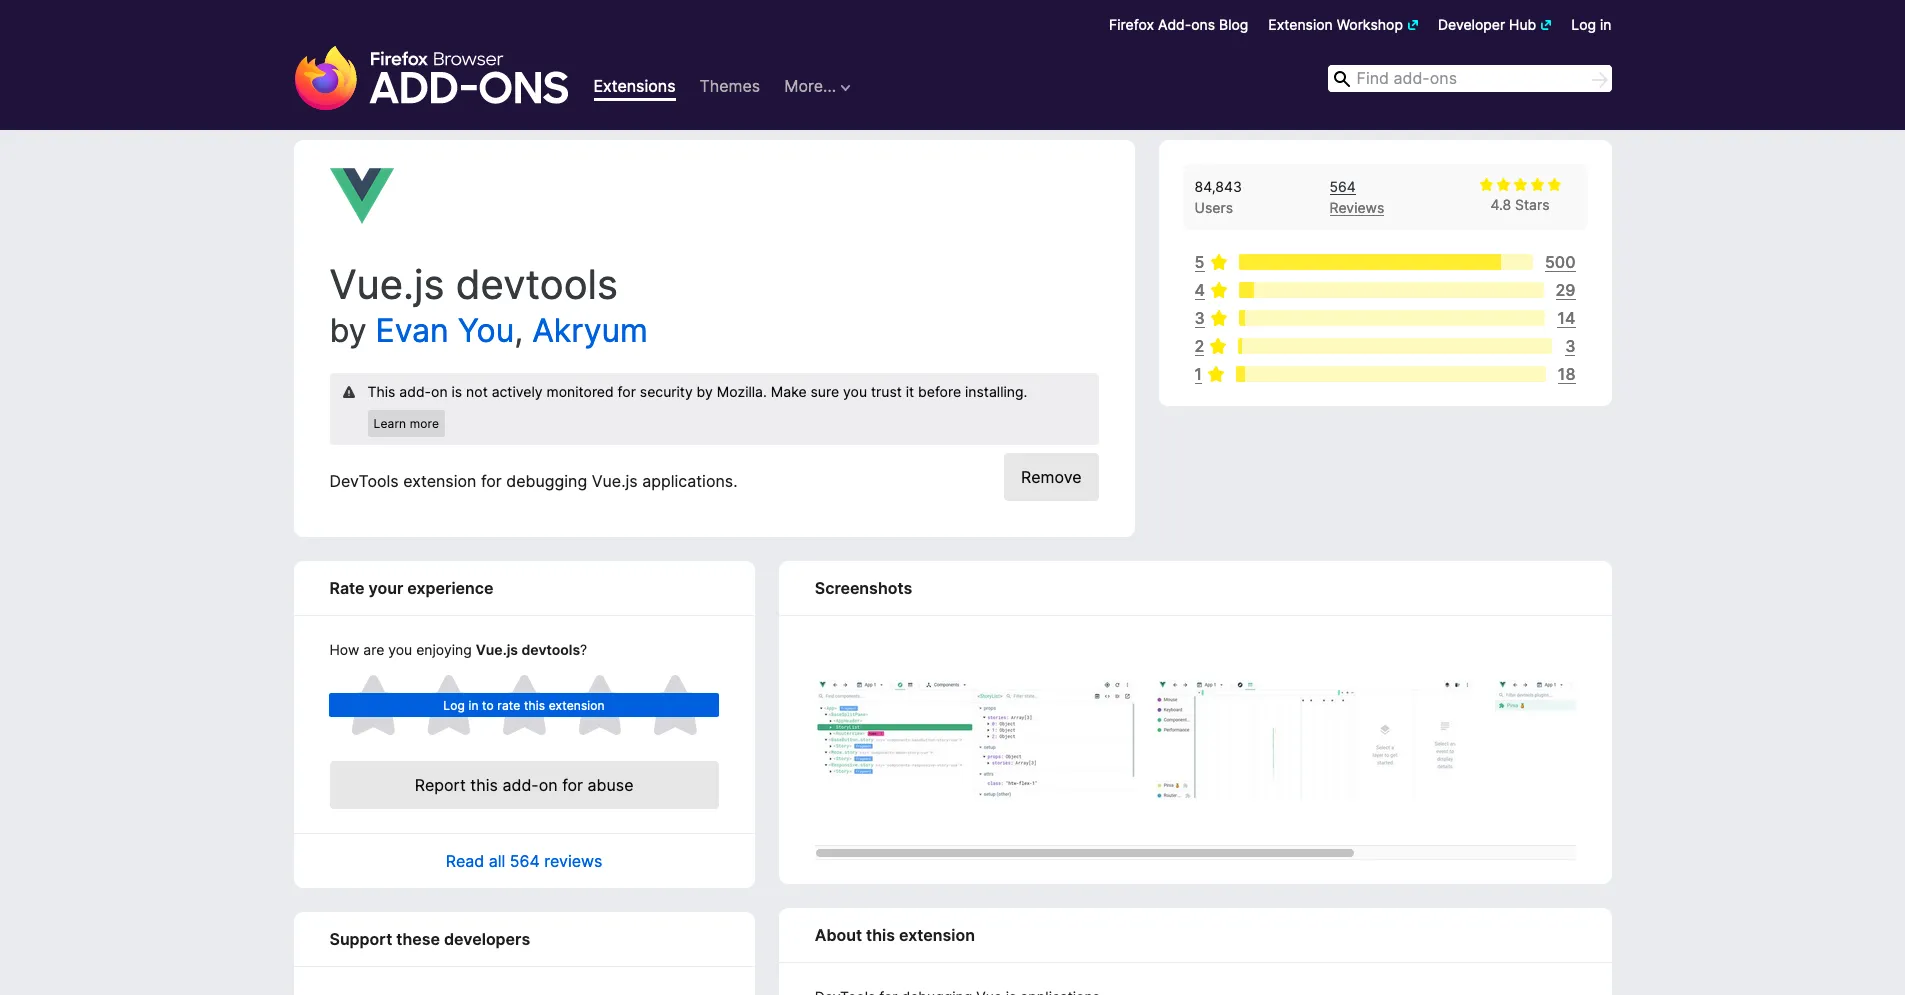
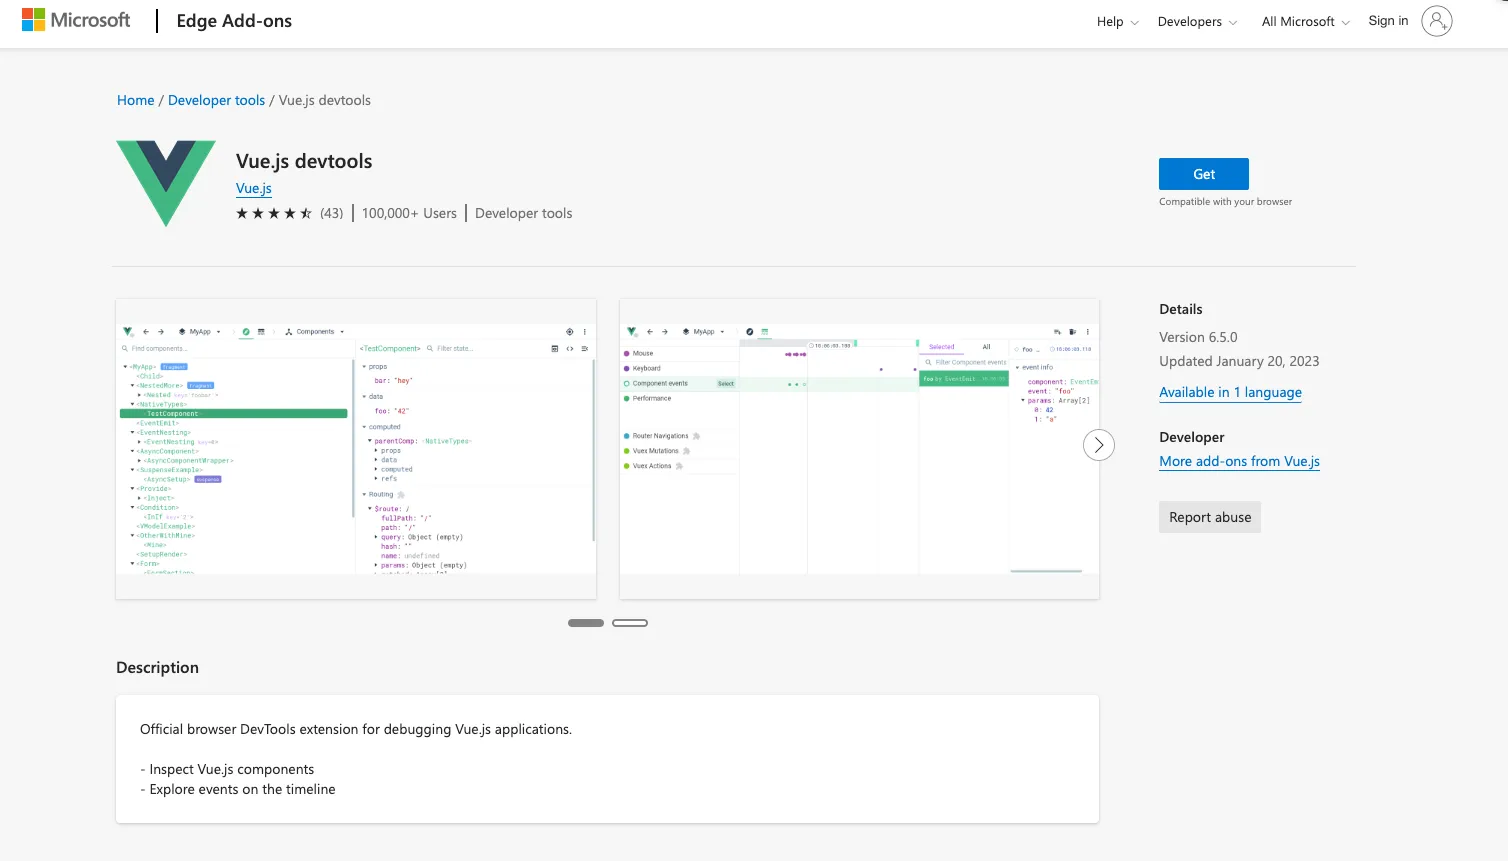
1. Installing Vue Devtools as a Browser Extension
In this section, we'll walk you through installing Vue Devtools as a browser extension. This simple setup will enable you to quickly start debugging your Vue.js applications directly from your browser.
2. Installing Vue Devtools as a Vite Plugin
If you're using Vite for your project, you can take advantage of the Vue Devtools Vite plugin, which provides seamless integration and enhanced functionality for debugging. This method is highly recommended for Vite-based projects due to its powerful features and smooth setup.
Compatibility:
Vue DevTools requires Vite v3.1 or higher.
Installation:
To get started, simply install the plugin using your preferred package manager:
-
npm:
$ npm add -D vite-plugin-vue-devtools -
pnpm:
$ pnpm add -D vite-plugin-vue-devtools -
yarn:
$ yarn add -D vite-plugin-vue-devtools -
bun:
$ bun add -D vite-plugin-vue-devtools
Usage:
Once installed, configure the plugin in your Vite config file:
import { defineConfig } from 'vite'
import vueDevTools from 'vite-plugin-vue-devtools'

export default defineConfig({
  plugins: [
    vueDevTools(),
  ],
})
3. Installing Vue Devtools as a Standalone App
If you're using an unsupported browser or have specific requirements, like running your application in Electron, you can install Vue Devtools as a standalone app for full functionality.
Install the package globally:
npm add -g @vue/devtools@nextOr locally as project dependency:
npm add -D @vue/devtools@nextOnce you installed the package globally, run:
vue-devtoolsThen add this code to the `` section of your application HTML file:
<script src="http://localhost:8098"></script>Or if you want to debug your device remotely:
<script>
  window.__VUE_DEVTOOLS_HOST__ = '<your-local-ip>' // default: localhost
  window.__VUE_DEVTOOLS_PORT__ = '<devtools-port>' // default: 8098
</script>
<script src="http://<your-local-ip>:8098"></script>
Note: Don't forget to remove it before deploying to production!
usually looks like this: 192.168.x.x
Then start your development server like you are used to, without killing the vue-devtools command (for example, open a new terminal). So you will be running both applications simultaneously.
npm run devStarting Devtools in our Browser
For our tutorial we will be running our Vue Devtools in our browser. Let’s explore how
-
Step 1: In your Vue.js application local setup. Right click and navigate to the inspect option. You can also use the F12 key as a shortcut.
-
Step 2: Select the more option to expand the tabs and select the Vue option.
Awesome progress ? now we have our Vue Devtools setup and running alongside our project. Now we can begin exploring its usage.
Debugging Components with Vue Devtools
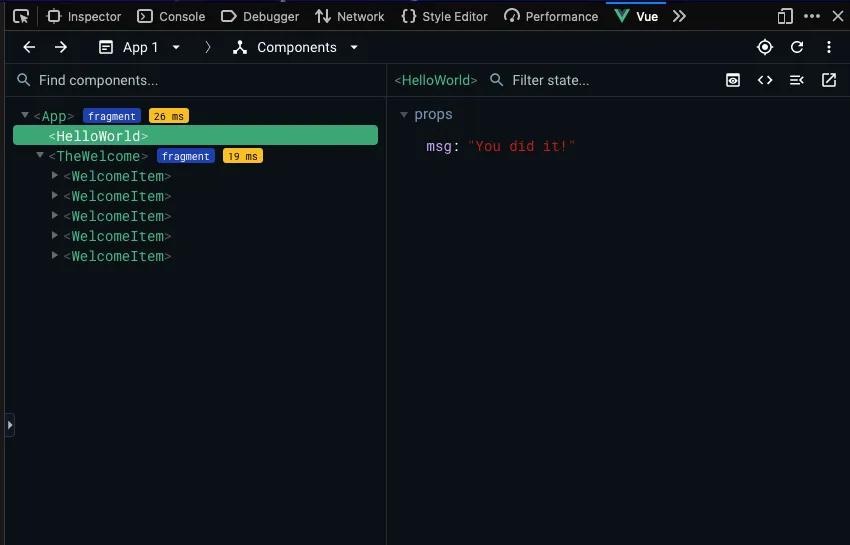
Vue Devtools offers powerful features to help you debug and understand your Vue.js components. One of the key tools for this is the Component Tree view.
To access it, simply click on the "Components" tab. Here, you'll find a hierarchical list of all active Vue components in your application. Each component appears as a tree node that can be expanded to reveal its child components. This allows you to easily check if a component is being rendered and inspect its structure.
For example, the App component acts as the root, and within it, you might find a child component like HelloWorld. Expanding the HelloWorld node reveals detailed information such as its props, data, and computed properties.
The Component Tree also offers interactivity, allowing you to select a component node and directly view or modify its properties and data in real time, making debugging much more efficient.
Debugging States, Events, Props, and More in Vue Devtools
In Vue.js applications, components and their states are at the core of communication between different parts of the app. Props and events are commonly used to share data between components. However, bugs can sometimes arise, or things may not work as expected. That’s where Vue Devtools makes debugging easier and faster.
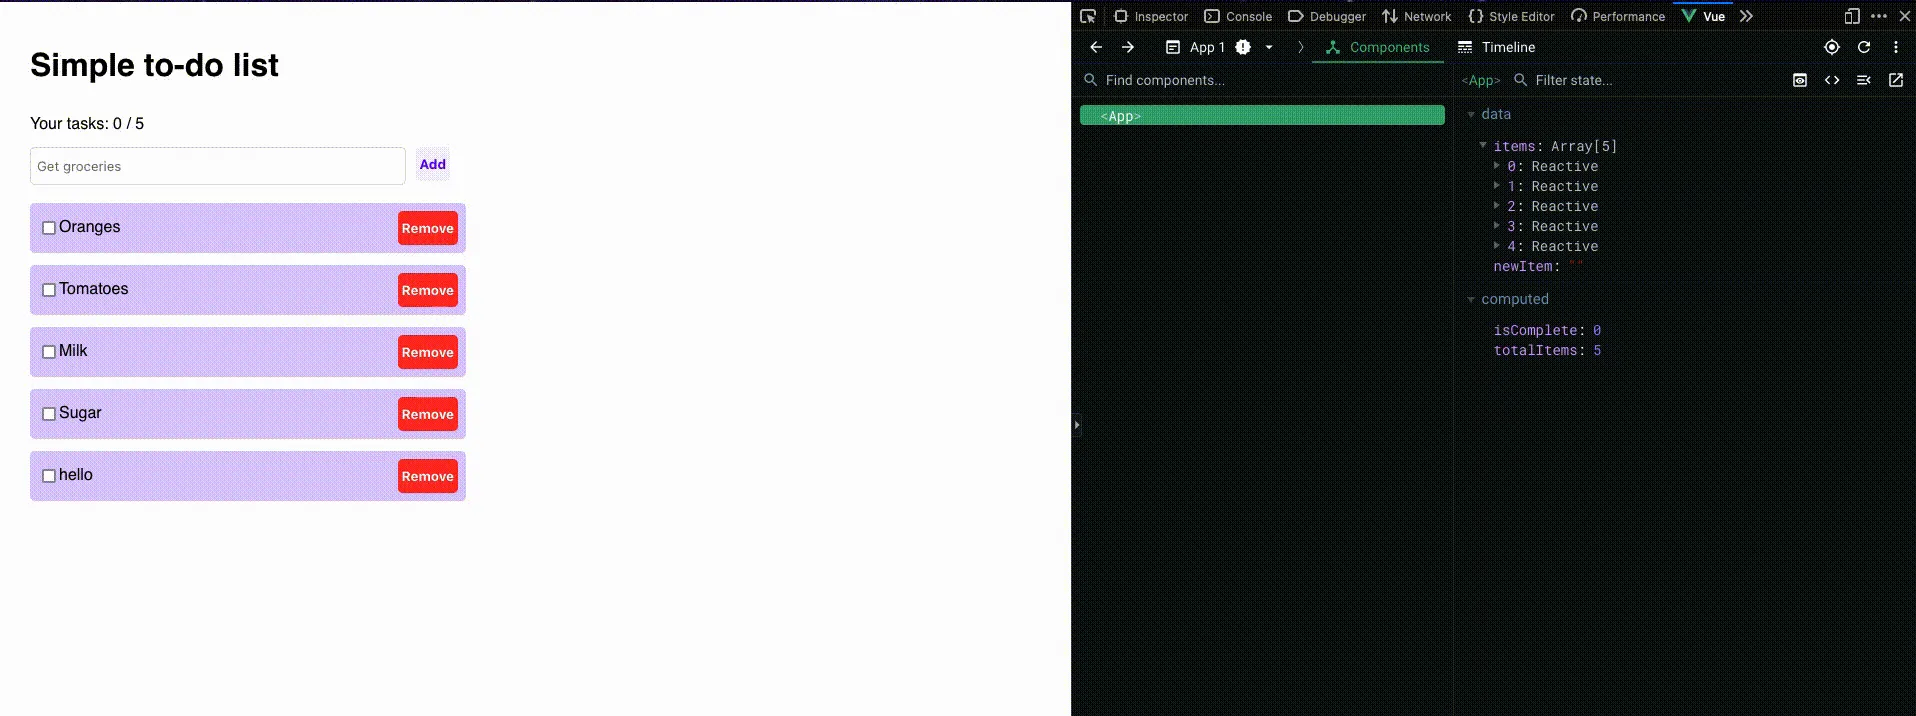
Monitoring Component States
In the Component Tree, you can monitor the state of your components. Any changes made to your component's data are immediately reflected in the Vue Devtools panel, allowing you to track and modify the data in real-time.
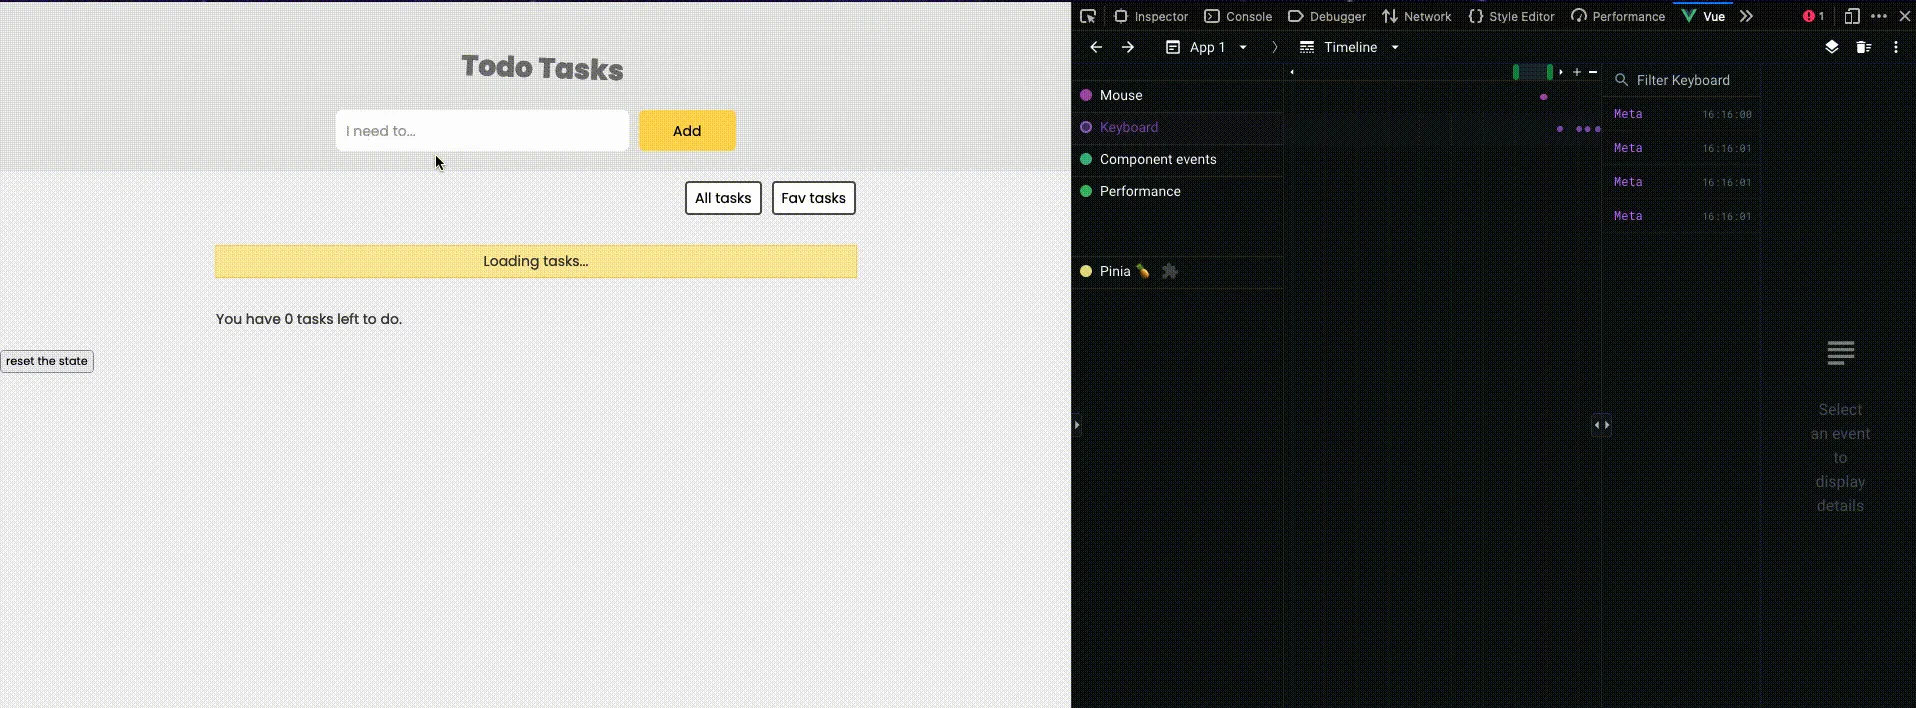
Using the Timeline Inspector
The Timeline Inspector allows you to track the history of your component's states and events. You can rewind to a specific point in time to see the state of a property at that moment, making it easy to diagnose issues.
With the Timeline Inspector, you can also verify if your component events are firing as expected.
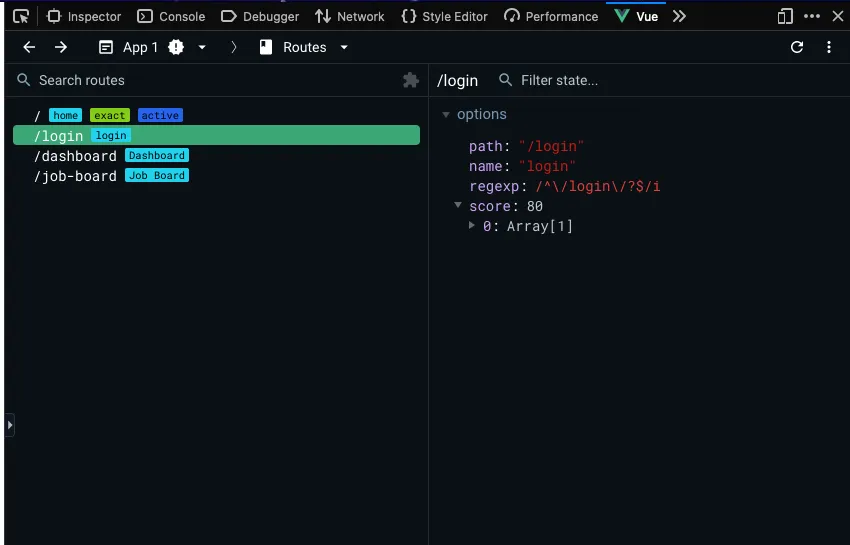
Monitor Routes
When building a Vue.js Single Page Application (SPA), Vue DevTools makes it easy to track and debug your routes and navigation flow. The Routing tab logs route data and history during transitions, giving you insights into your application's route behavior. It also displays all your application routes along with their configuration options.
Debugging Your Pinia Stores
As applications grow in complexity, managing state within components can become challenging. The solution? A central store that all components can access to manage data.
State management tools like Vuex and Pinia help simplify this process. Lately, Pinia has gained significant popularity, and in this section, we'll explore how Vue DevTools can improve your debugging experience with Pinia.
The great news is that Pinia integrates seamlessly with Vue DevTools, enhancing your development workflow in both Vue 2 and Vue 3.
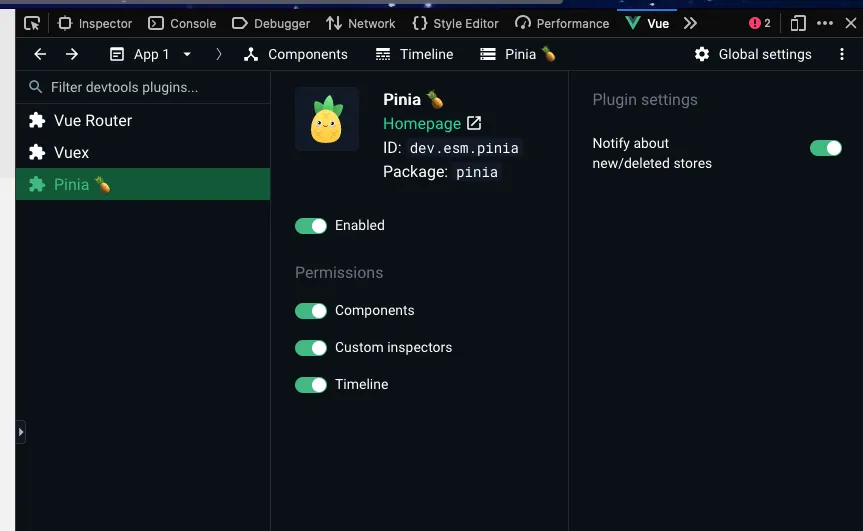
Vue DevTools provides a dedicated tab for your Pinia stores, making it easier to view and monitor store data and state. This feature significantly improves the development process by simplifying store management and debugging in your Vue.js application.
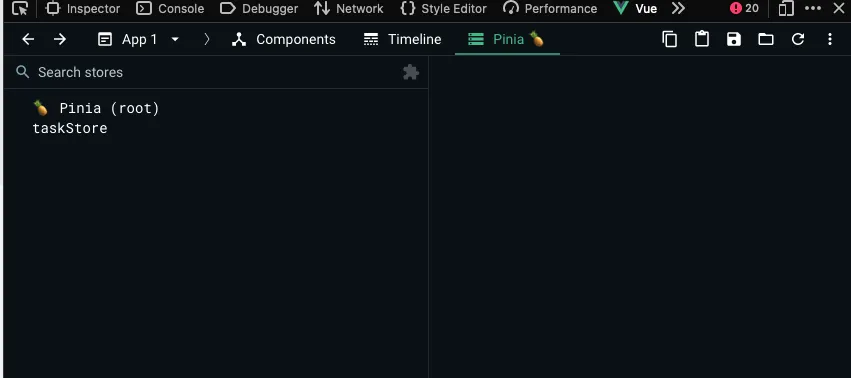
Let’s see how Vue DevTools works with a Vue.js application that uses Pinia.
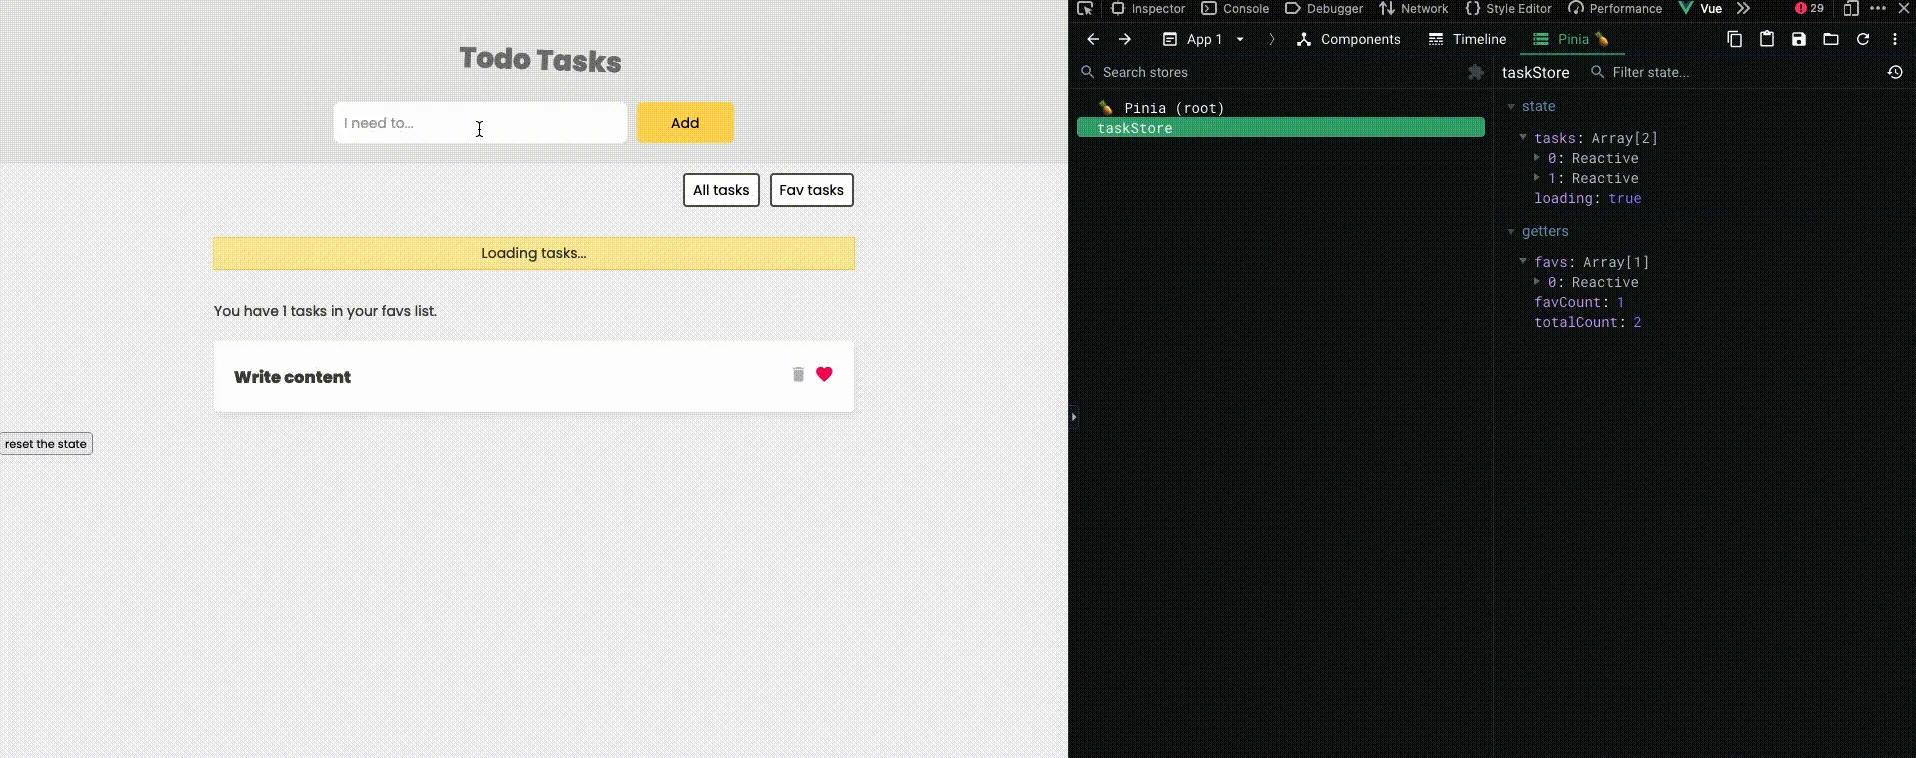
In our todo application, which features simple create and delete actions, Vue DevTools lets us track mutations to the store's state and update the store directly from the browser.
What's even better is that the time travel feature works with Pinia stores, allowing you to preview previous store states in the timeline view.
Conclusion
I hope you found this article on Vue DevTools helpful in understanding how this powerful tool can elevate your Vue.js development process.
For Vue.js developers, Vue DevTools is indispensable for efficient debugging. That said, it's important to note that the JavaScript ecosystem offers other valuable debugging tools. Many seasoned developers recommend combining Vue DevTools with additional tools to optimize the debugging experience and achieve better results.
Stay tuned for upcoming articles where I'll dive deeper into other Vue.js debugging tools, such as Nuxt DevTools and the Vite plugin for Vue DevTools. These tools will further enhance your debugging workflow and offer even more features for your Vue.js applications.
Start learning Vue.js for free

Comments
Latest Vue School Articles

5 Component Design Patterns to Boost Your Vue.js Applications


Vibe Coding a Collaborative Editor with Comment Support with Nuxt UI and Jazz
Our goal is to be the number one source of Vue.js knowledge for all skill levels. We offer the knowledge of our industry leaders through awesome video courses for a ridiculously low price.
More than 200.000 users have already joined us. You are welcome too!
© All rights reserved. Made with ❤️ by BitterBrains, Inc.