
Understanding and Measuring Nuxt and Vue.js Performance

Part of the series: Vue.js 3 Performance
If you've delved into Vue.js and performance for a while, there's a good chance you've already checked out my earlier series, "Vue.js Performance" where I dove deep into various aspects of web performance related to Vue.js 2 applications. Together, for almost a year, we explored web performance theory, best practices, and solutions to common bottlenecks. It's both an honor and a pleasure to return to you with an exciting new series - "Vue.js 3 Performance"!
Like before, my goal is to help you grasp the fundamental aspects that influence the loading and runtime performance of Vue.js applications. This time I will focus much more on Nuxt, but there will also be plenty of generic Vue.js tips and episodes. I'll equip you with tools that you can seamlessly integrate into your daily workflow to keep performance under control. Throughout this series, I'll share techniques learned in the last seven years of optimizing the performance of Vue Storefront (which utilizes Nuxt) and collaborating with our customers.
After completing the ten in-depth articles I have planned, you'll have the knowledge to ensure your application remains fast as it grows. You'll also be well-equipped to tackle performance bottlenecks on multiple layers. Additionally, you'll gain a fundamental and in-depth understanding of all the factors that influence the real-world performance of modern Nuxt.js applications.
Let's dive into a fundamental question - "What does it mean that your application is 'fast'?"
What does it mean that your application is "fast"?
Contrary to popular belief, a fast application is not determined solely by a high Lighthouse score. In fact, relying on Lighthouse as a key metric is one of the least reliable approaches to answering this question. I've already written a comprehensive article with detailed explanations behind this perspective (which I highly recommend you read). However, to save you time, let me provide a brief summary:
When you run a Lighthouse audit for your website, it's always within a specific environment, be it your computer, a remote server, or an emulated Motorola G4 running on Google Data Center (this is how it works on Google's Page Speed Insights). One constant remains - it's not the environment your users experience. To truly assess whether our application is genuinely fast or not, we must observe its behavior in front of real users and directly collect data from them.
Accessing real-world data
Fortunately, you don't have to set up any additional monitoring tools to access the real-world data - Google is already doing it for you! Whether you're aware of it or not, whenever you visit a website using the Chrome browser, you send information about its loading speed directly to Google. They make this data accessible through a tool called the Chrome User Experience (CrUX) Dashboard.
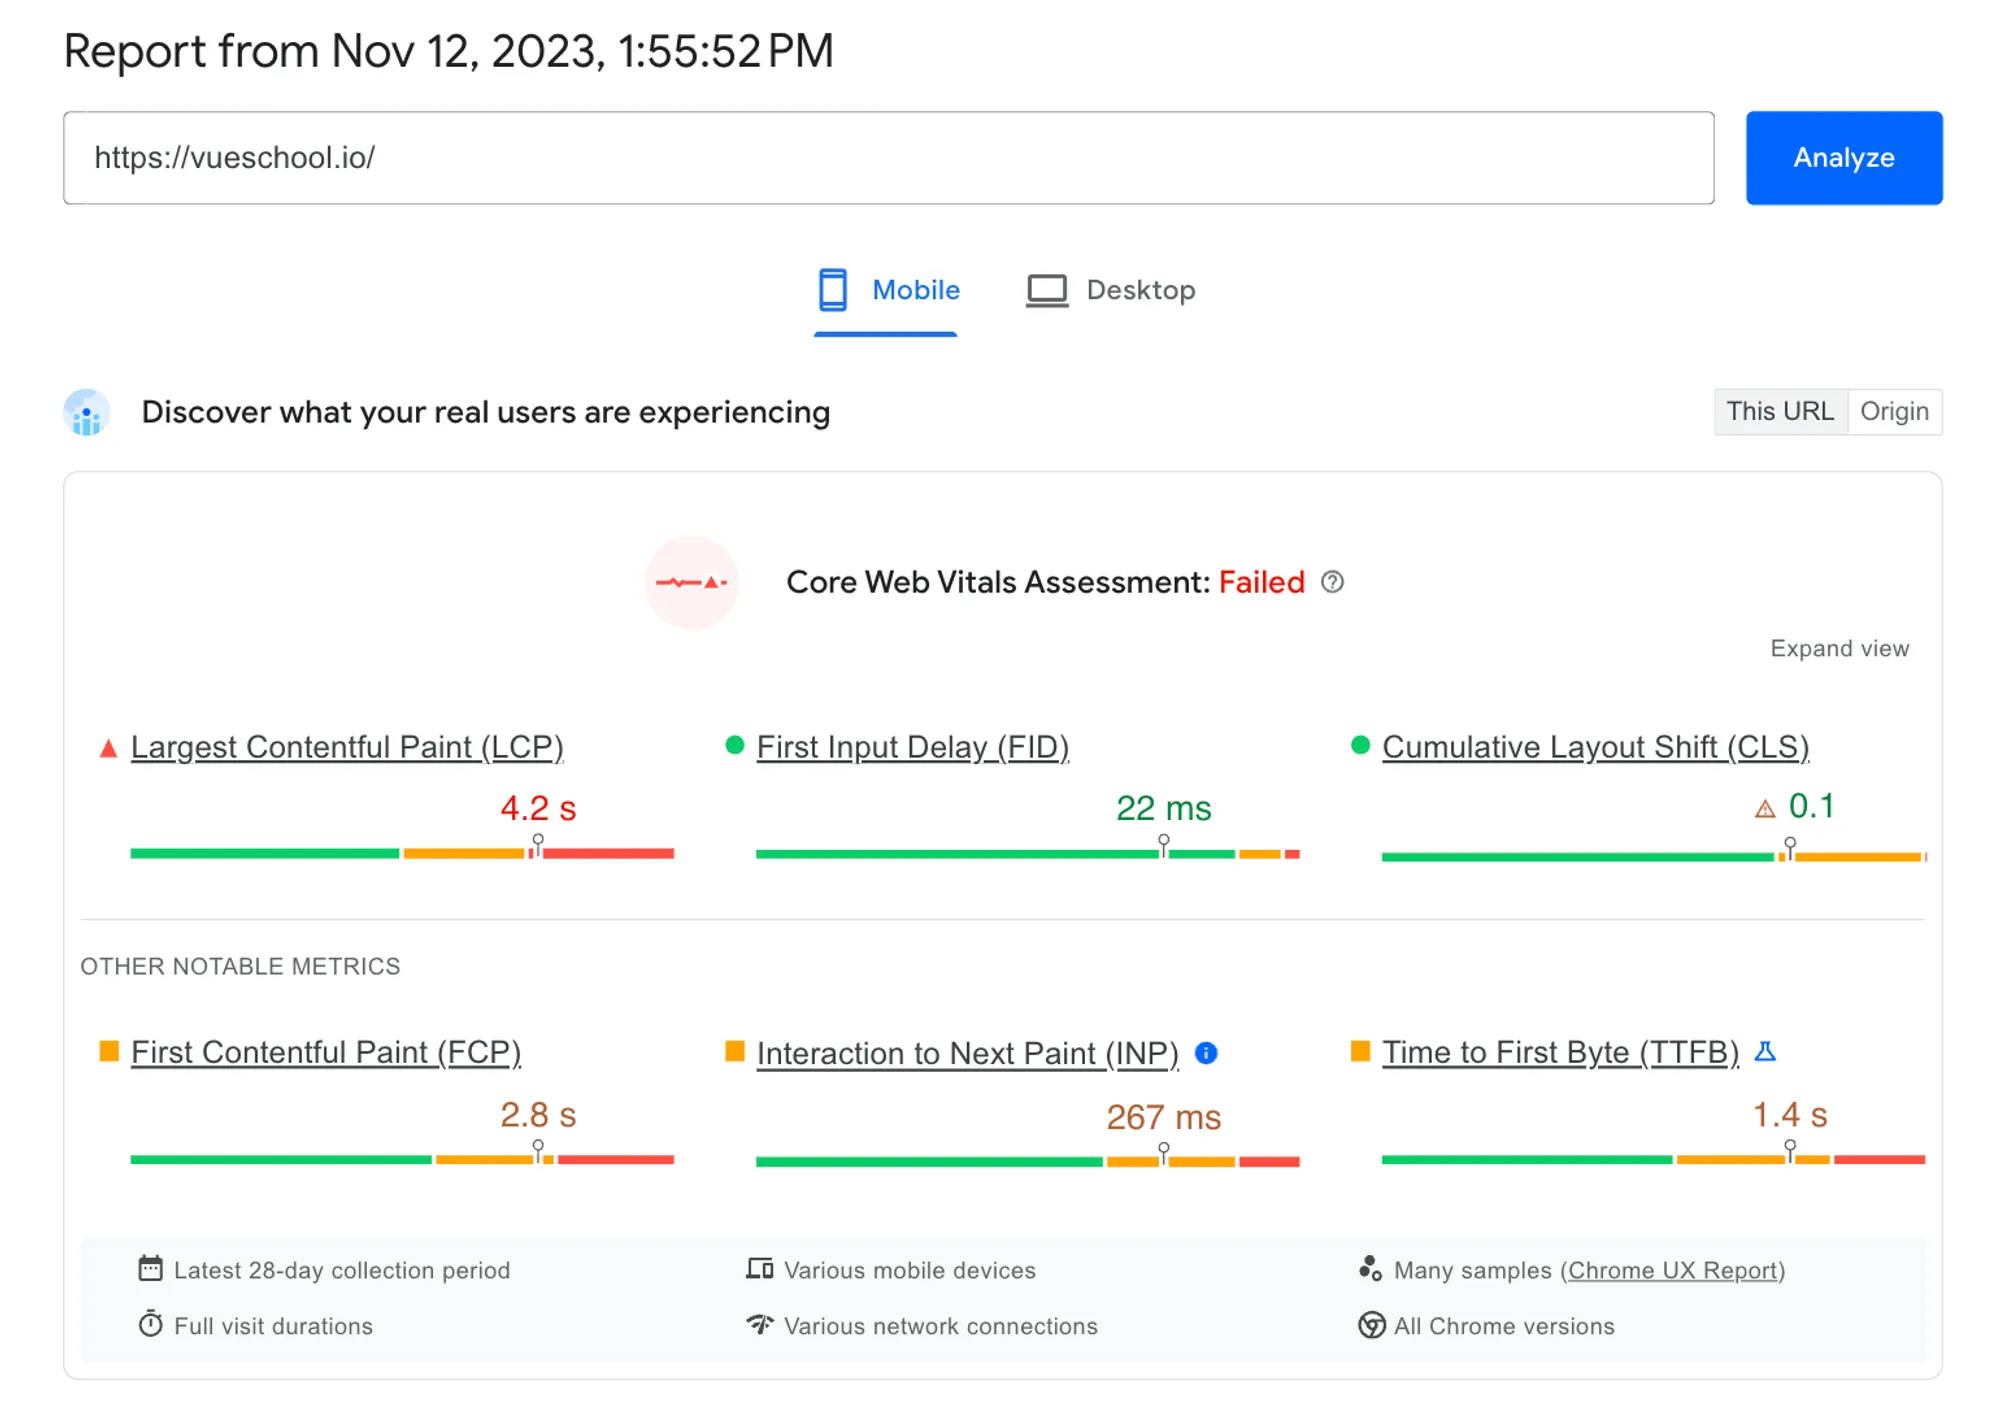
There are several ways to access this data, with the simplest being to input your website's URL into Google Page Speed Insights. This tool, developed by Google, provides insights into key performance metrics based on real-world user experiences.
However, it's important to note that this data isn't a full sample, as it's limited to Chrome users. In my experience, performance on Apple devices (which represent the biggest sample of omitted data) is generally better, though not significantly. While CrUX is a reliable source for real-world performance metrics, knowing that a full sample might yield slightly better results is an important nuance to be aware of. If you want to get a full overview of your users’ performance, you should integrate monitoring tools like Sentry into your application.
Another method to access real-world performance data for your application, offering historical context and segmentation for different types of devices, is by directly navigating to the Chrome User Experience Dashboard. Simply go to this website and paste your URL in the form:
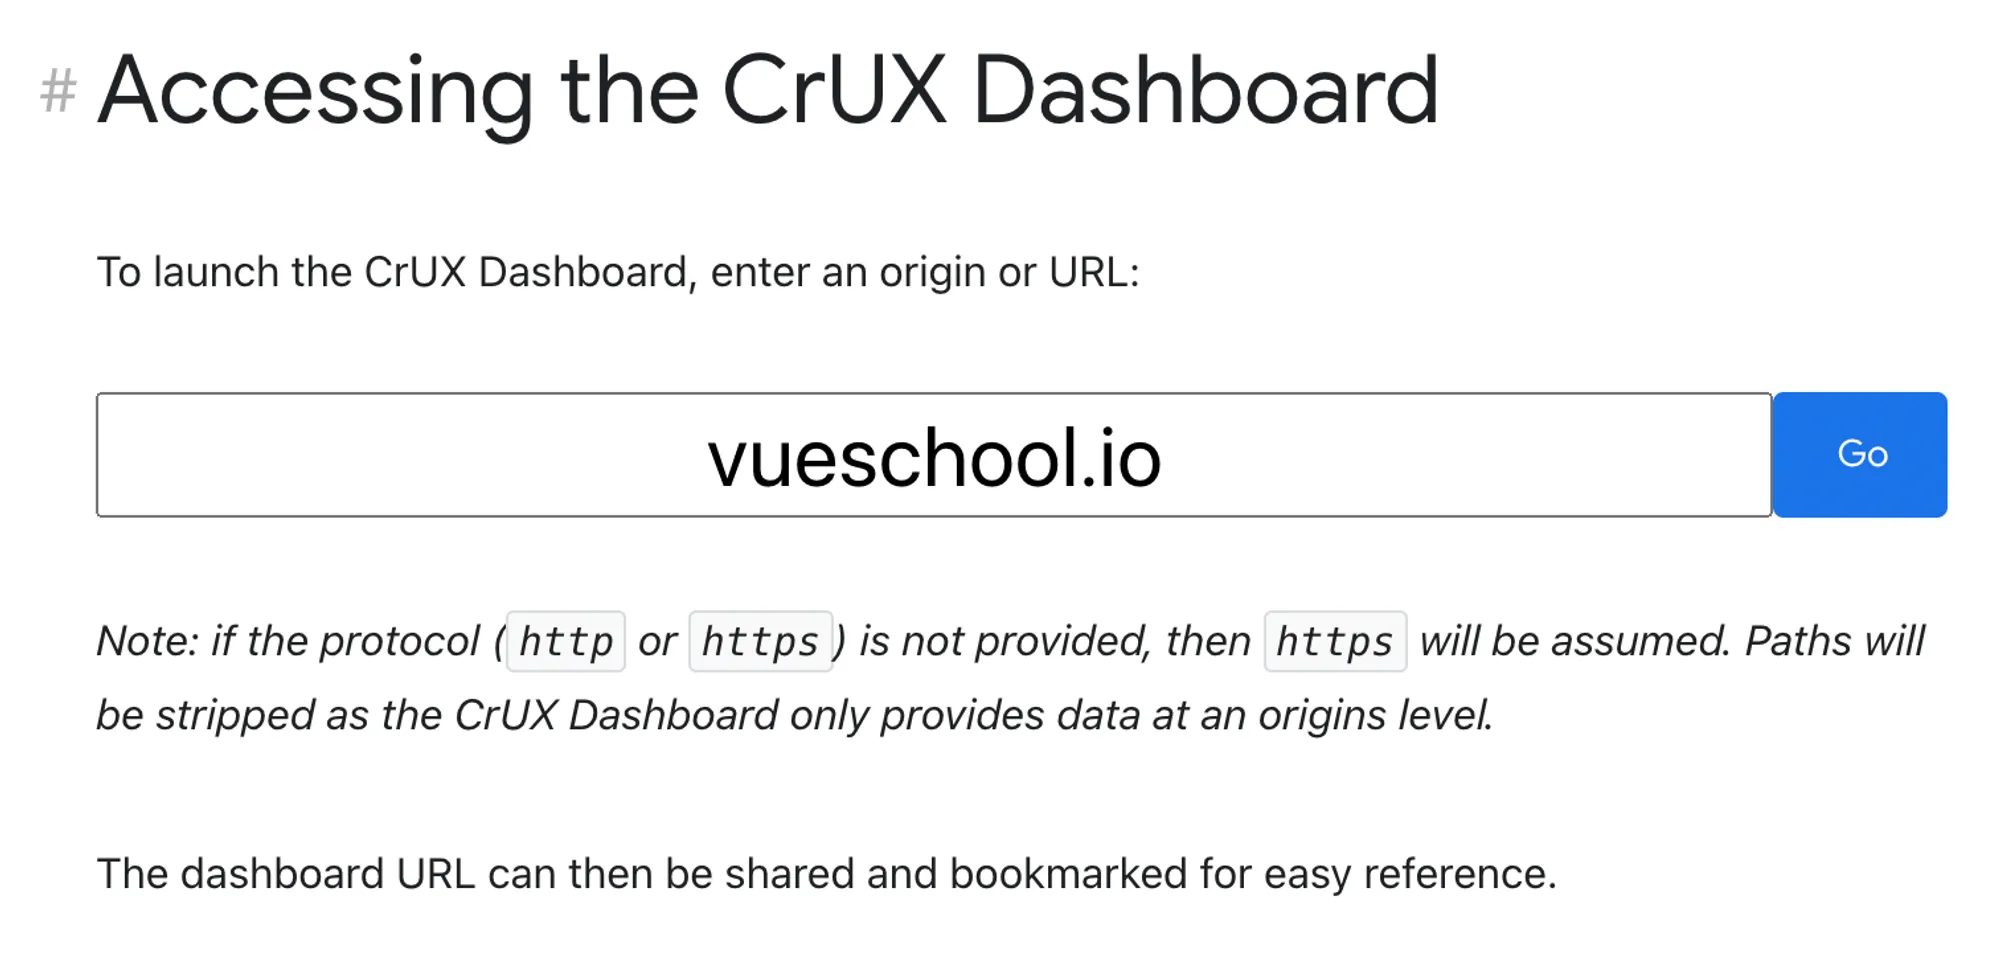
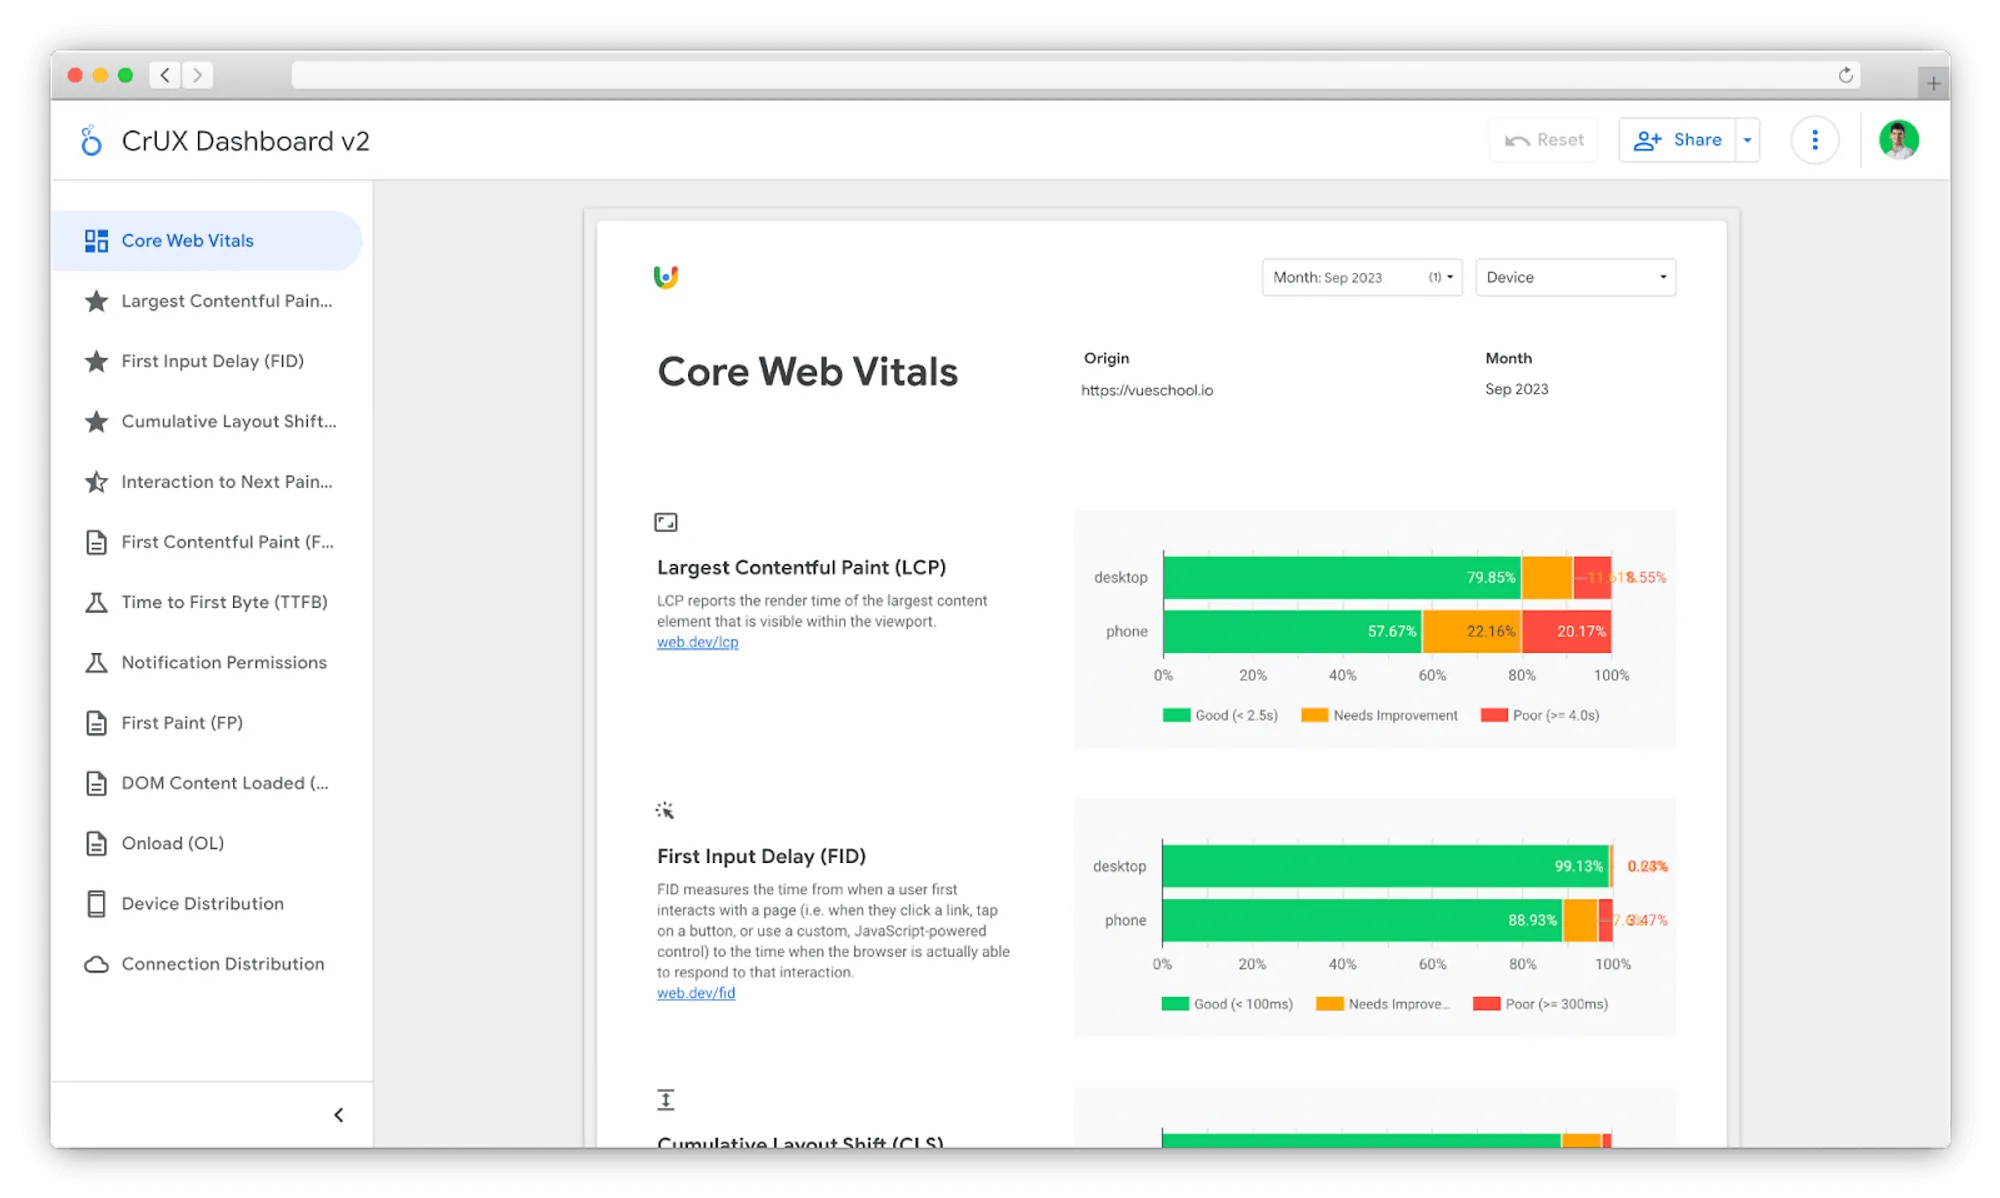
It will redirect you to a dashboard with detailed information about different metrics describing your page performance segmented into device types.
What metrics should we optimize?
Not all metrics that you will find there are equally important. The three metrics you should prioritize fixing first are the so-called Core Web Vitals. These three metrics are particularly important because they are the smallest data set that provides a complete high-level overview of your users’ experience. Of course, we can break down the experience almost into infinity, but when we want to know if the experience is good or bad on a high level, these three metrics will answer this question!
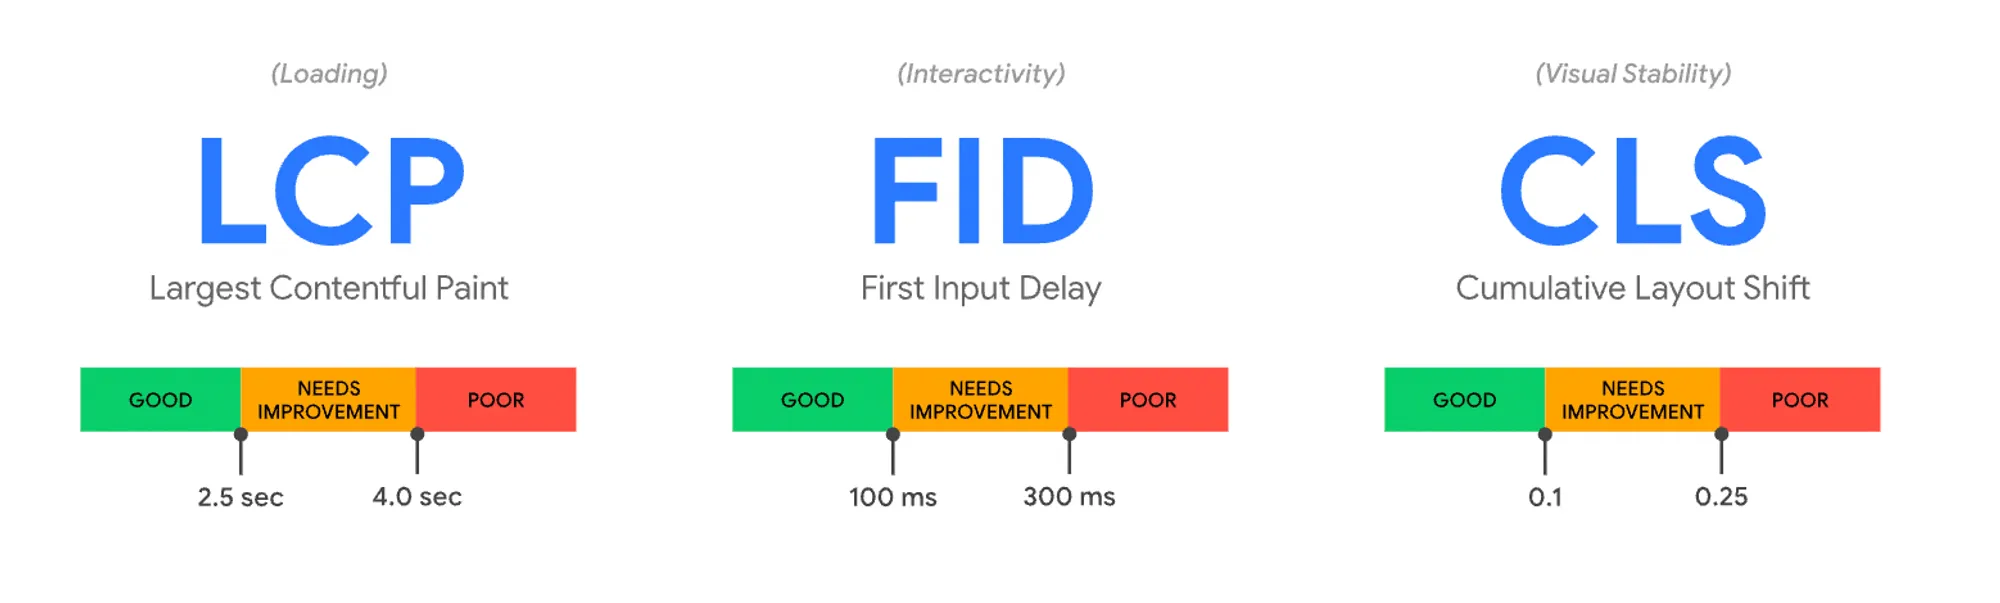
- The Largest Contentful Paint describes the loading experience. It tells how fast the largest element in the viewport loads. In most cases it’s an image.
- First Input Delay describes the interactivity experience and tells how long the user has to wait until their first interaction is executed (in other words, it measures the delay between the users’ action like ‘click’ and your app's response to it). It’s worth mentioning that this metric will be replaced with Interaction to Next Pain in March 2024!
- Cumulative Layout Shift describes visual stability. Often during page loading, a lot of elements change their position. This metric will tell you how much of your layout shifted its original place since the page started loading.
Getting them right comes with a prize! Google uses the Core Web Vitals as a ranking signal which means for each of them being “good” for the 75th percentile of your users' visits, you’re getting a slight boost in SEO. You can easily check if you’re getting them right using Page Speed Insights - just keep the numbers green!
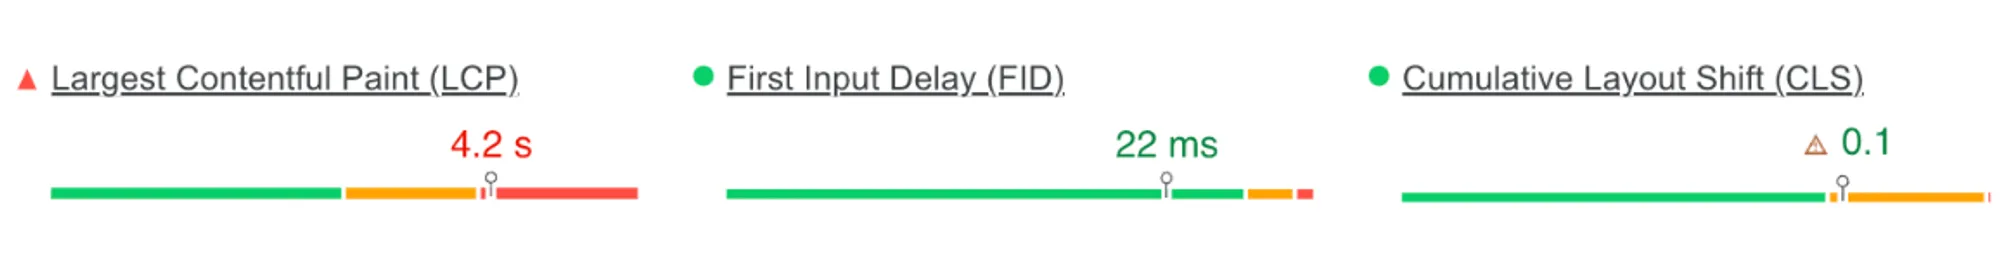
In the above image, we will get an SEO boost from two of three metrics.
What influences Nuxt.js application performance?
Up until now, we talked about the general performance concepts without diving into the specific context of Nuxt. However, armed with an understanding of the key factors and how to measure them, you now have a high-level understanding of what influences the performance of your Nuxt application.
Let's now dive deeper into Core Web Vitals and explore the factors that most significantly affect them:
- Cumulative Layout Shift (CLS) is a relatively straightforward metric to optimize. It entails placing appropriately sized placeholders for dynamic elements whose dimensions are uncertain until fully loaded (e.g., text nodes from a CMS, data grids or custom fonts). I will dedicate a separate article for CLS optimization, but rest assured, this is typically the less challenging aspect. The real optimization challenge lies with the other two metrics, and I'll explain why.
- Largest Contentful Paint and First Input Delay metrics are primarily influenced by the size of your JavaScript bundle. JavaScript that requires parsing and execution often delays the rendering of critical elements or the responsiveness to user interactions such as clicks.
The baseline performance of Nuxt, often referred to as the "Hello World" performance, serves as our starting point. In essence, your application won't surpass this performance level (well, there's a little trick we'll uncover in the upcoming articles, but I won't reveal it just yet). Fortunately, Nuxt offers excellent out-of-the-box performance, and our objective is to maintain it.
Although the goal may seem straightforward—"reduce the amount of JavaScript shipped"—achieving it can be challenging in the world of single-page application (SPA) frameworks. Each new feature, component, or library added to your application comes at the cost of increased JavaScript in your bundle. Even if you adhere to best practices and employ recommended libraries, your application will likely slow down as it scales.
So, how can we mitigate the performance impact of new code additions?
Optimizing the critical rendering path
To achieve this goal, it's crucial to optimize what's known as the 'critical rendering path'. The critical rendering path consists of the code necessary to render the current view (or, in Server-Side Rendered applications, to make it interactive). Ideally, this should be the only code that executes eagerly after your application launches. Any other code, such as elements below the fold, chat windows, and most third-party scripts required for component interactivity, should be loaded later. Unfortunately, by default, all the JavaScript in our bundle gets downloaded and executed eagerly, even if it's not immediately needed, and browsers cannot selectively omit it. Don't worry—throughout this series, we will explore various techniques to address this issue.
Before delving into optimization strategies, let's first examine what factors influence Nuxt's bundle size.
How does our bundle grow?
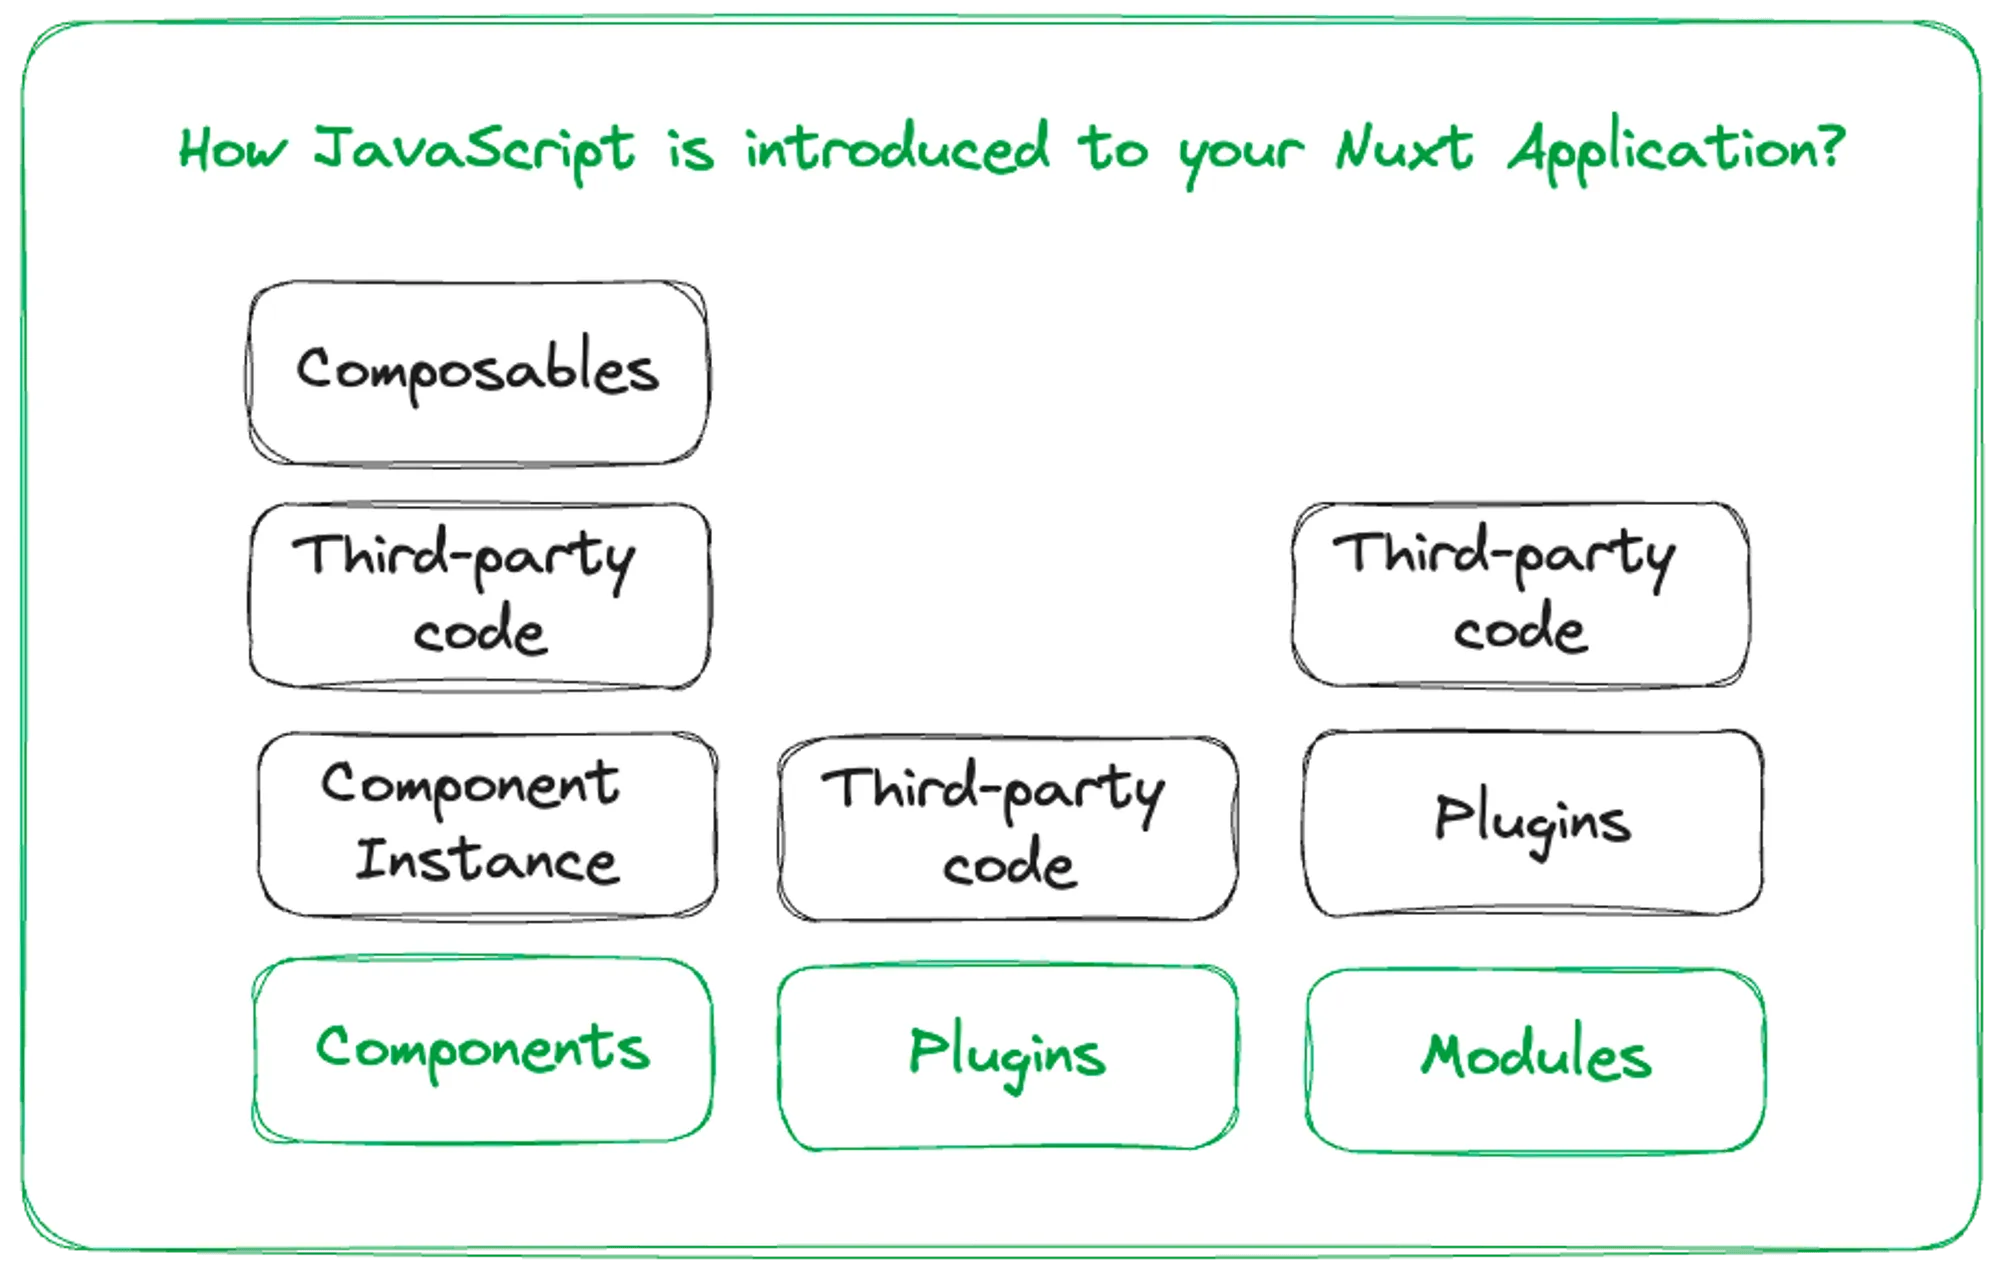
There are generally two main ways in which new code is being introduced to your Nuxt.js application:
- Through components each component introduces its own v-dom code and dependencies (libraries, composables) to your bundle. In most cases, components are the main contributors to your application bundle size.
- Through plugins - when we add third-party code that needs to be shared across the whole application, we do this through plugins. This is the second biggest contributor to your application’s bundle size.
You may be asking - “what about modules”? While most modules work only during the build step, they often also introduce their own plugins. You can easily check if a module you want to install introduces plugins with third-party code to your application.
- Find the GitHub repository of the module you want to install on nuxt.com/modules.
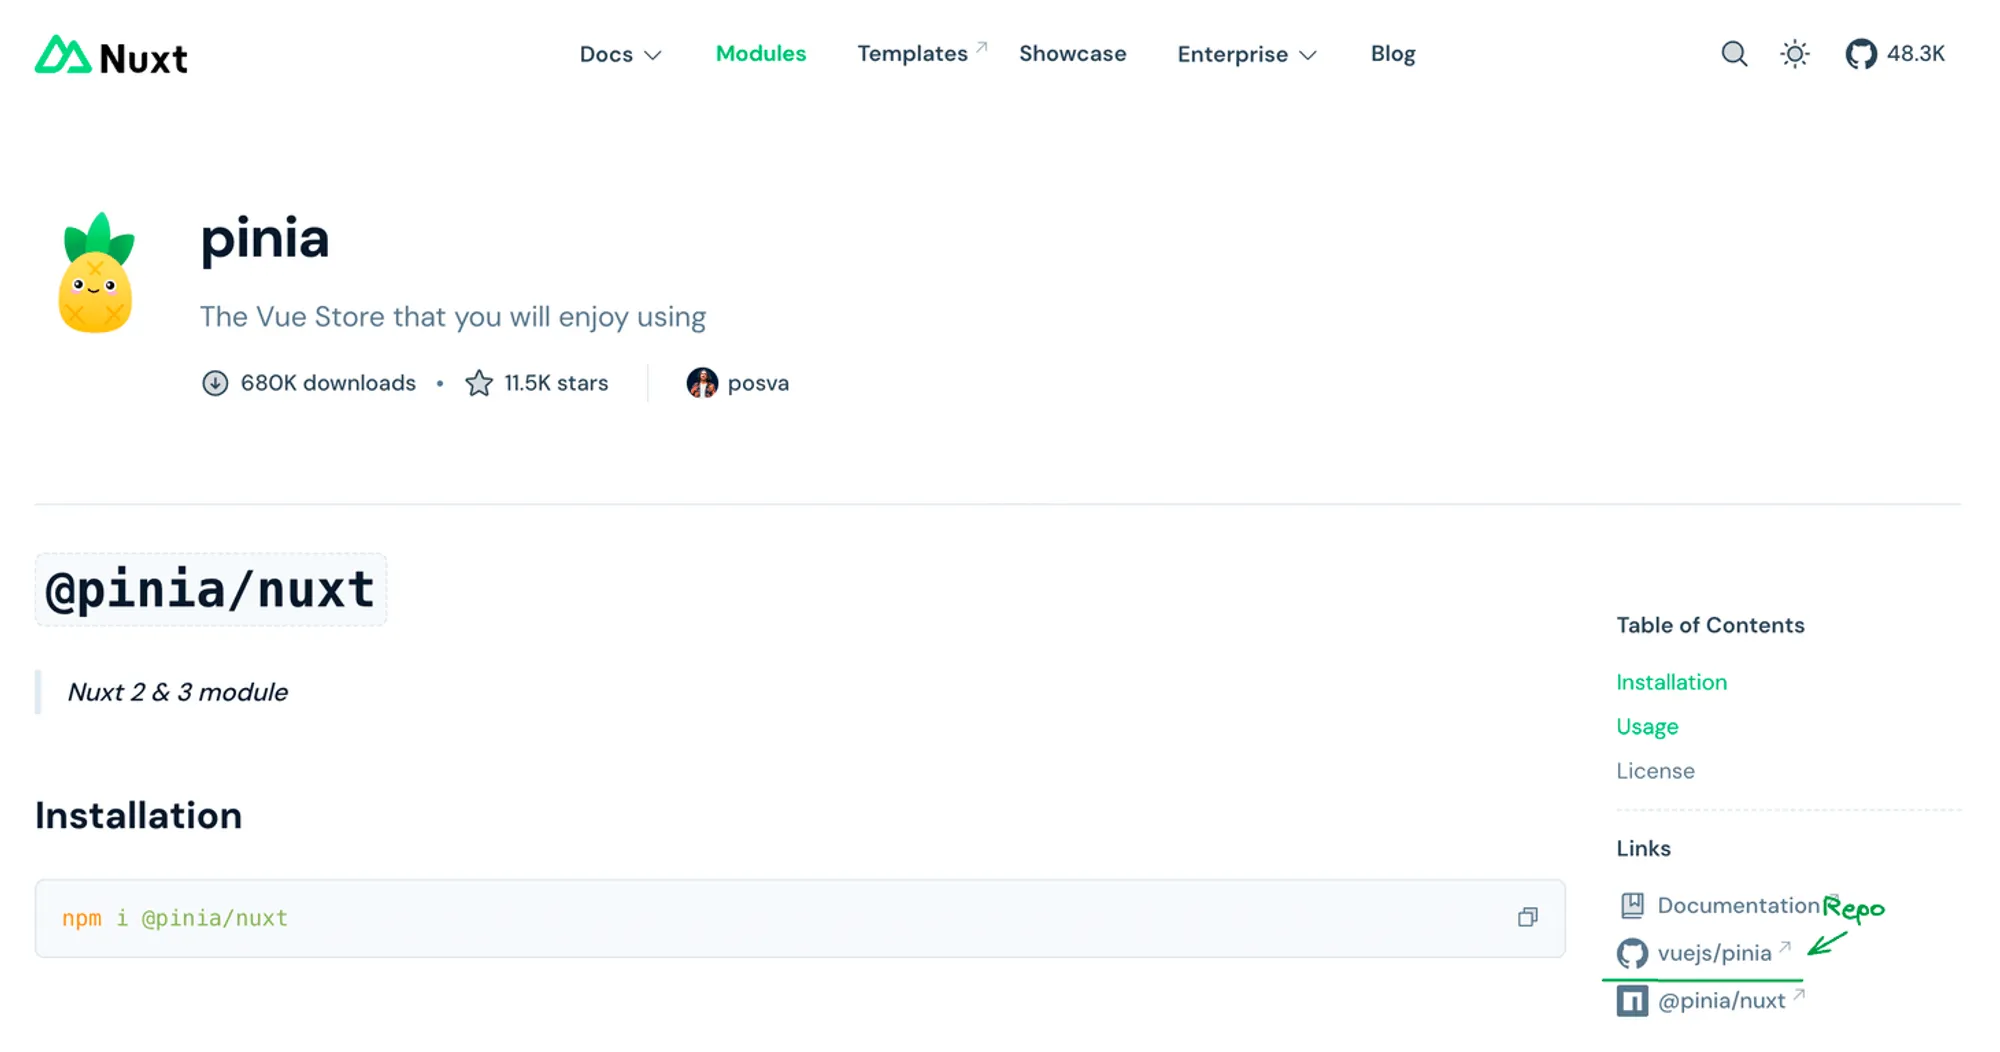
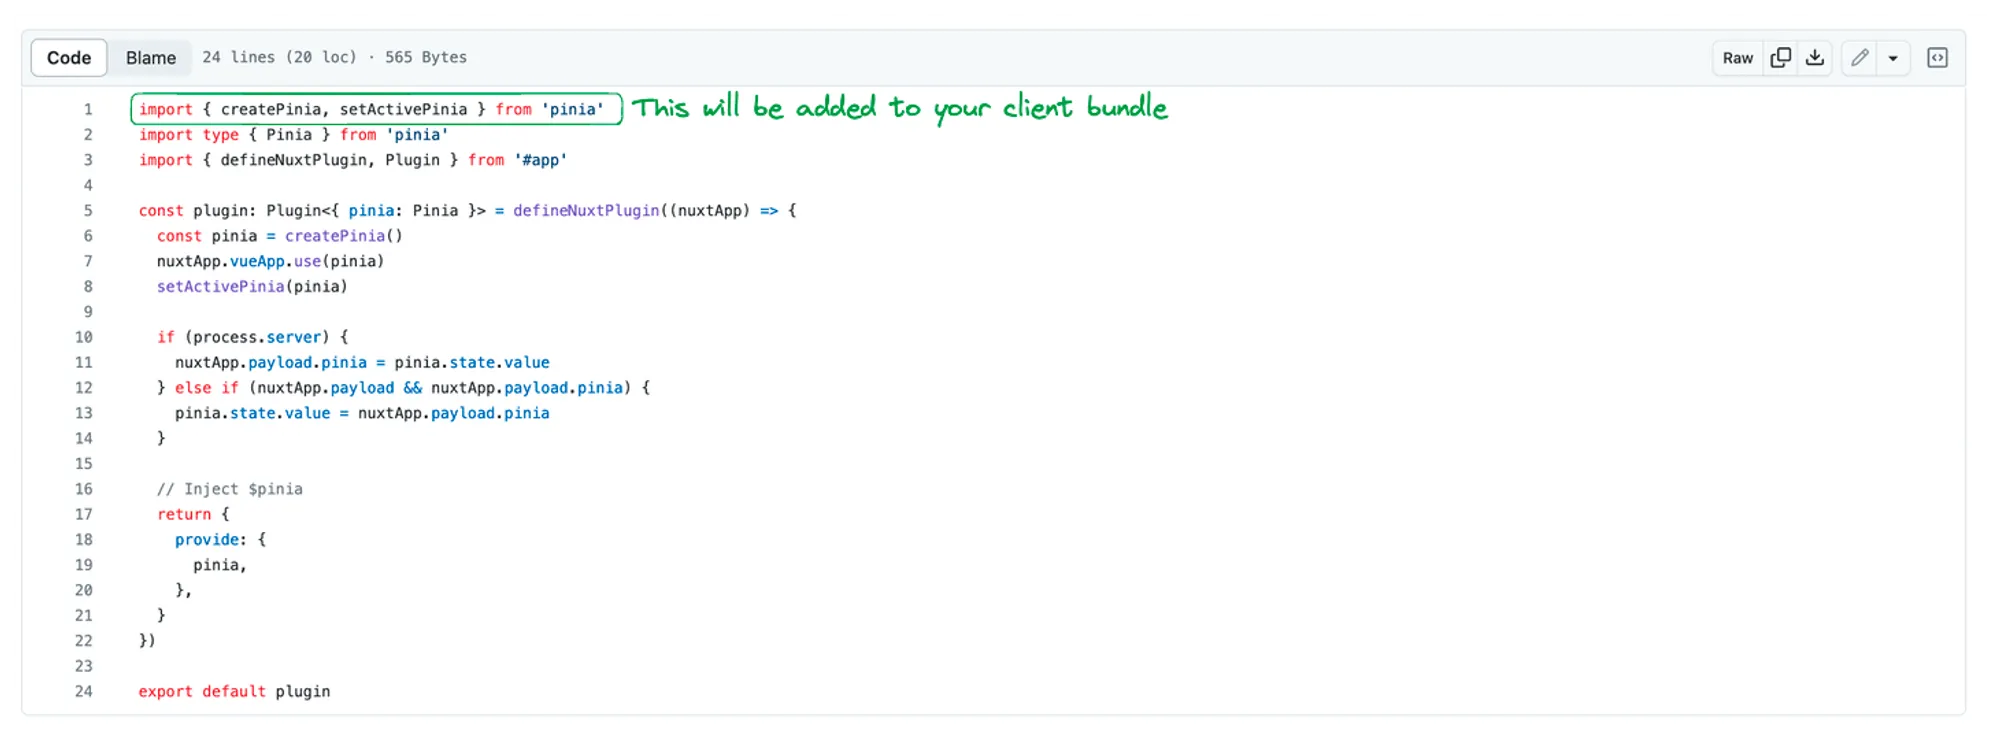
- In the repository, click on a search bar and look for the phrase “addPlugin”. This is a function used in Nuxt Modules to register custom plugins. Plugins can usually be found in each module's “runtime” folder
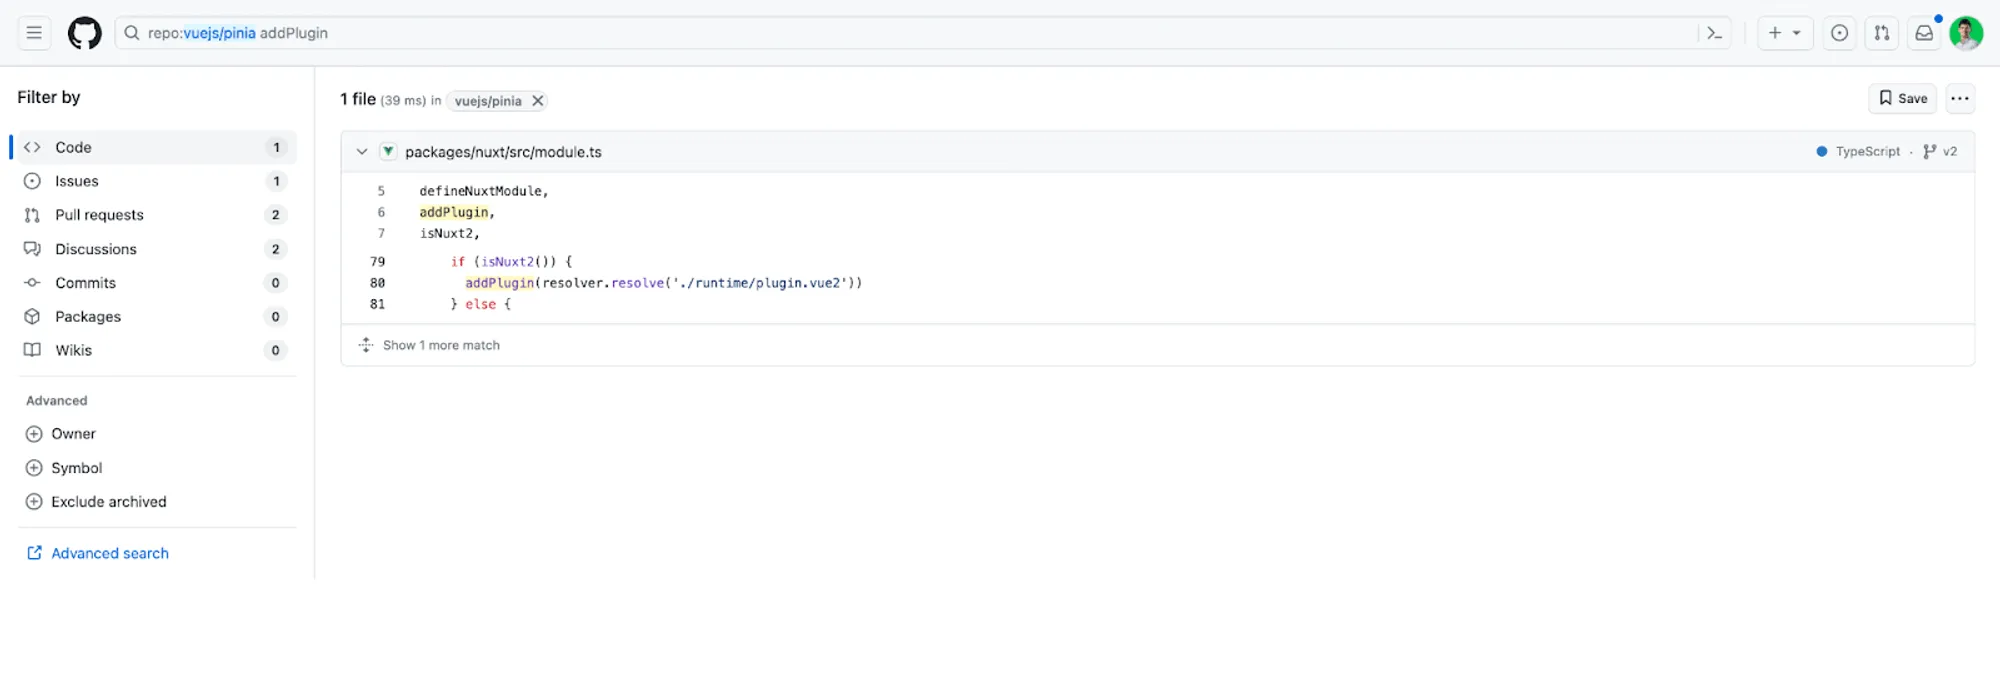
.
- Check the imports in the module file to see what will be added to your client bundle
Inspecting bundle with Nuxi Analyze
It would be very hard to optimize the bundle size without a good way of inspecting what is inside..
You can use the extremely useful command "npx nuxi analyze" that uses vite-bundle-visualizer under the hood (which works almost identically to webpack-bundle-analyzer). This command provides a visual representation of your application's bundle, allowing you to assess the space consumed by each element.
When you observe a large box in the image, it often indicates a potential candidate for breaking down into smaller pieces, lazy loading, or finding a replacement with a more efficient alternative, especially for third-party libraries.
- Large blocks with elements inside almost always can be broken down into smaller ones by importing individual elements instead of whole objects: "import { element } from 'library'" instead of "import library from 'library'"
- Large blocks without elements inside can be loaded lazily instead of being part of the main bundle.
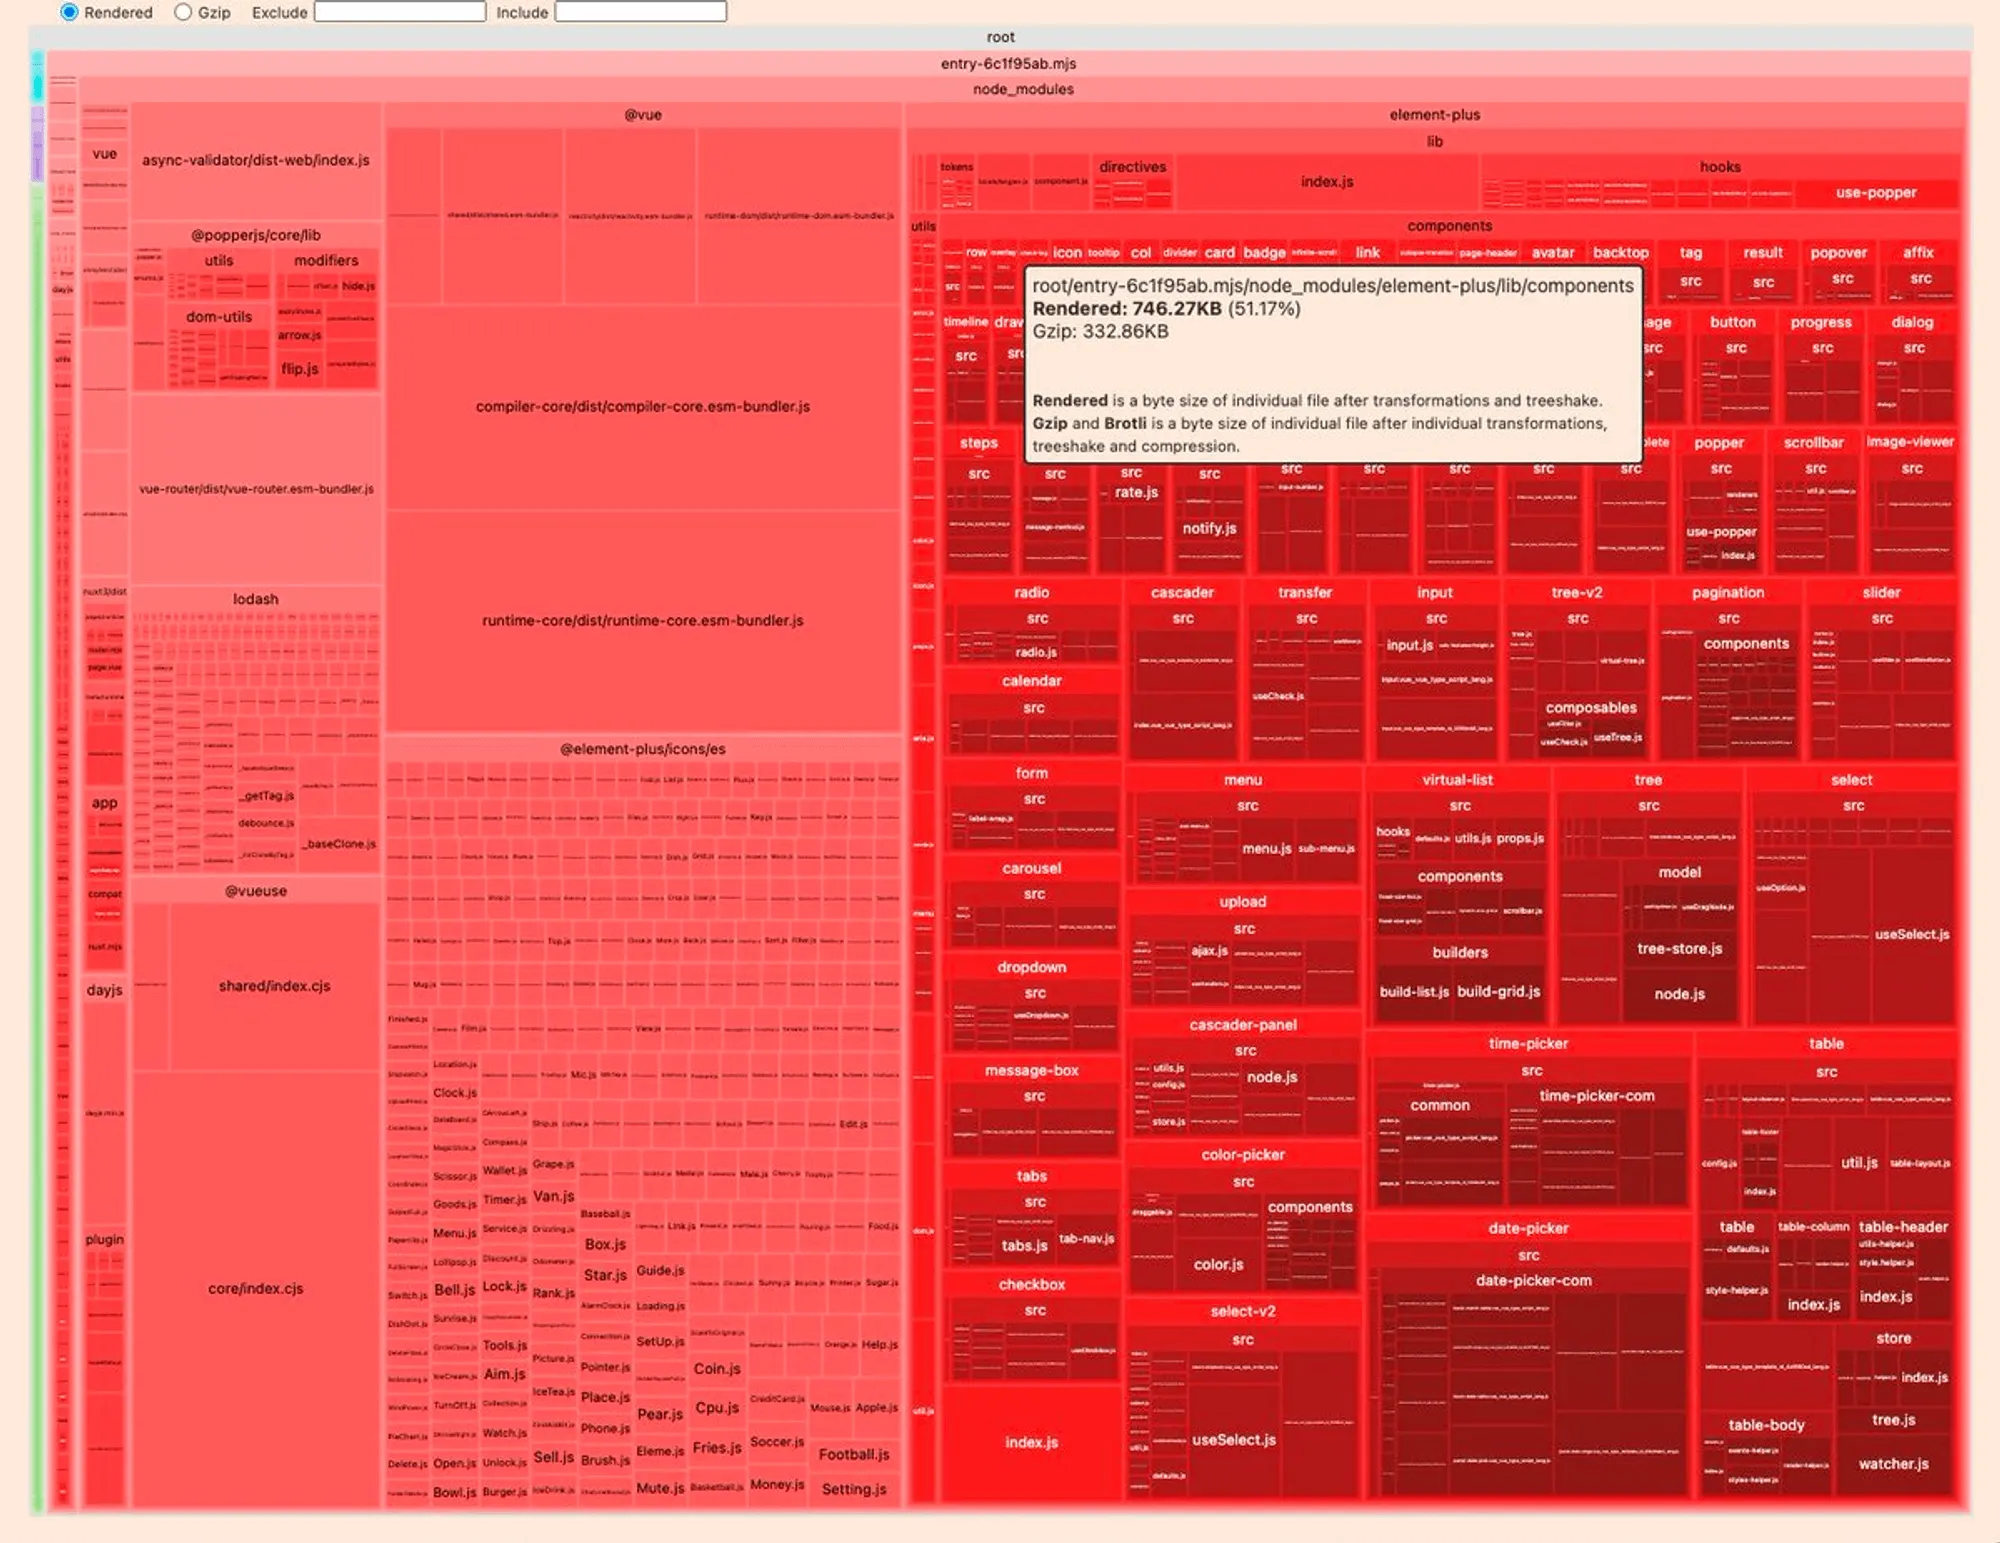
For example, in the below image, we see that UI Library Element UI is responsible for more than half of our bundle size ? This can definitely be broken down into smaller import statements.
Summary
Optimizing your Nuxt application should be done in the context of real-world data. Although Lighthouse can provide a high-level overview of your application's performance, it can sometimes be misleading. It's crucial to rely on real-world data to gain a deeper understanding of how your users experience your application.
When examining real-world performance, prioritize three key performance metrics known as Core Web Vitals. These metrics offer insights into various aspects of your application's performance. You can easily find them on Page Speed Insights or access more detailed data through the Chrome User Experience Dashboard.
To maintain optimal performance, it's essential to minimize the impact of new code introduced into your application and optimize the critical rendering path. Achieving this is a challenging task, as each new feature addition typically involves adding code to our bundle. However, we will explore various techniques to help mitigate these challenges and enhance performance.
Related Courses
Start learning Vue.js for free

Comments
Latest Vue School Articles

5 Component Design Patterns to Boost Your Vue.js Applications


Vibe Coding a Collaborative Editor with Comment Support with Nuxt UI and Jazz
Our goal is to be the number one source of Vue.js knowledge for all skill levels. We offer the knowledge of our industry leaders through awesome video courses for a ridiculously low price.
More than 200.000 users have already joined us. You are welcome too!
© All rights reserved. Made with ❤️ by BitterBrains, Inc.